Fig. 3.
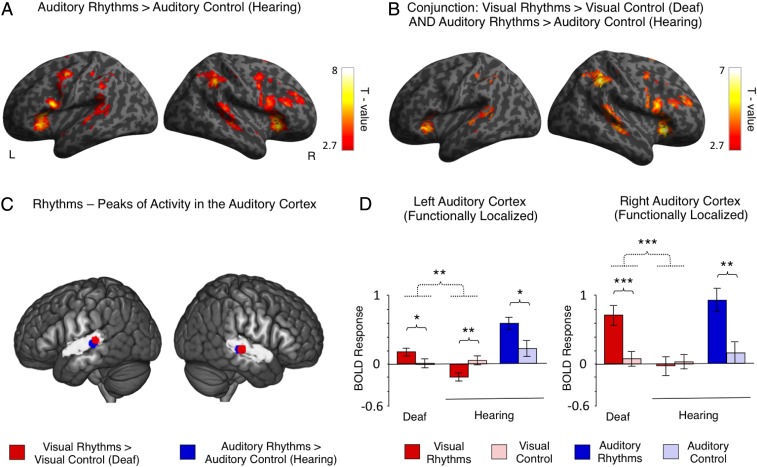
The auditory cortex processes rhythm independently of sensory modality. (A) Activations induced by auditory rhythms relative to regular auditory stimulation in hearing subjects. (B) Brain regions that were activated both by visual rhythms relative to regular visual stimulation in deaf subjects and auditory rhythms relative to regular auditory stimulation in hearing subjects (conjunction analysis). (C) Peaks of activation for visual and auditory rhythms in the auditory cortex. Peaks for visual rhythms relative to regular visual stimulation in deaf subjects are illustrated in red. Peaks for auditory rhythms relative to regular auditory stimulation in hearing subjects are depicted in blue. The high-level auditory cortex is illustrated in gray, based on an anatomical atlas. The peaks are visualized as 6-mm spheres. Note the consistency of localization of peaks, even though deaf and hearing subjects performed the task in different sensory modalities. (D) The results of an ROI analysis in which activations in the auditory cortex induced by visual rhythms and auditory rhythms were used as independent localizers for each other. ROIs for comparisons between visual tasks were defined based on activation in the auditory cortex induced by auditory rhythms relative to regular auditory stimulation in hearing subjects. ROIs for comparison between auditory tasks were defined based on visual rhythms vs. regular visual stimulation contrast in deaf subjects. Dotted lines denote interactions. Error bars represent SEM. Thresholds: (A and B) P < 0.005 voxelwise and P < 0.05 clusterwise. (D) *P < 0.05; **P < 0.01; ***P < 0.001.

