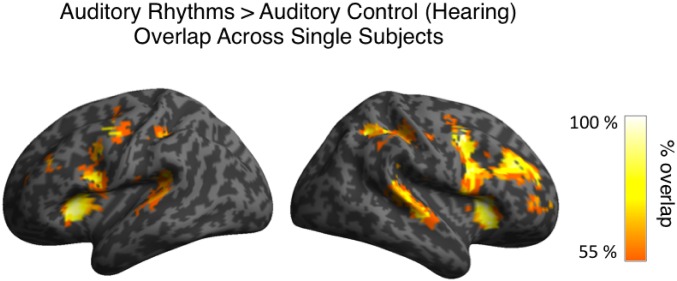
Fig. S1.
Overlap in single-subject activations for auditory rhythms relative to auditory control across all hearing subjects. Each single-subject activation map was assigned a threshold of P < 0.05 voxelwise and P < 0.05 clusterwise. Only overlaps equal to or greater than 55% of all hearing subjects are presented.

