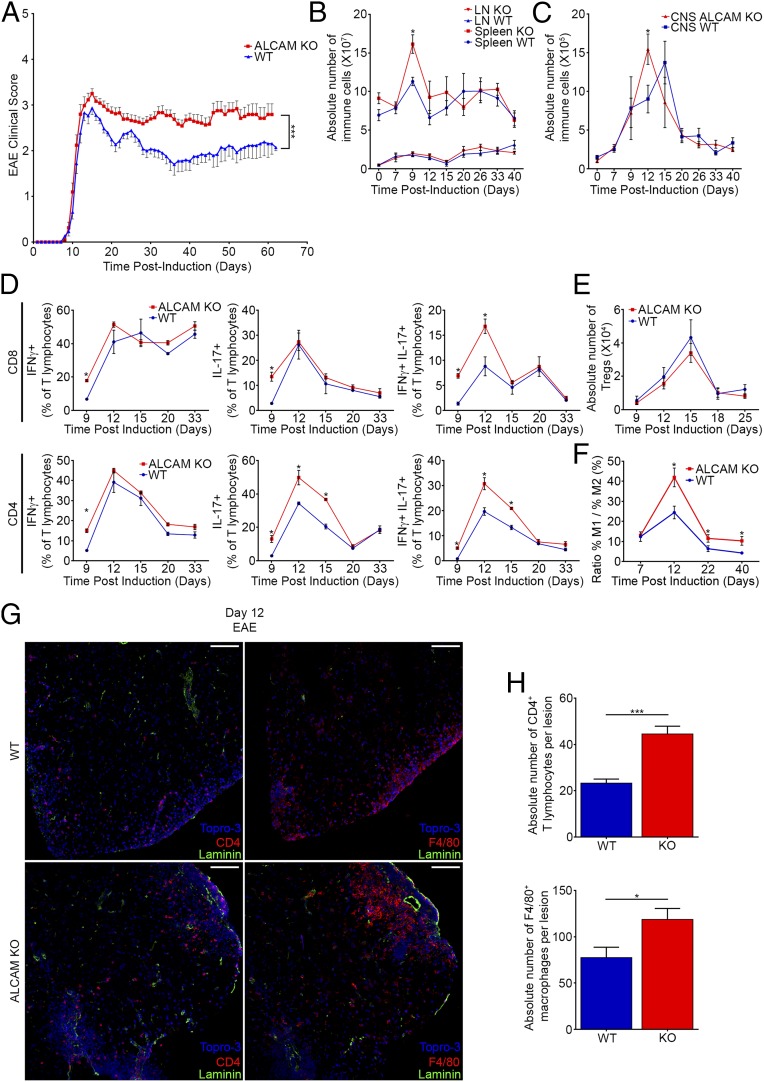
Fig. 2.
ALCAM KO mice develop a more severe active EAE. (A) Mean cumulative clinical EAE score from MOG35–55–immunized C57BL/6 WT and ALCAM KO mice. Data shown are the mean ± SEM of 40 mice per group and representative of n = 12 independent experiments. Absolute numbers of immune cells isolated from the spleens and LNs (B) or from the CNS (C) of WT and ALCAM KO mice at different dpi of EAE. Data shown are the mean ± SEM of 3–12 animals per time point and representative of n = 8 independent experiments. (D) Percentage of IFNγ-, IL-17–, or IFNγ and IL-17–expressing CD4+ and CD8+ T lymphocytes isolated from the CNS of WT and ALCAM KO mice at different dpi of EAE, as assessed by flow cytometry. Data shown are the mean ± SEM of 3–5 animals per time point and representative of n = 5 independent experiments. (E) Absolute numbers of CD4+CD25+FOXP3+ regulatory T lymphocytes infiltrating the CNS of ALCAM KO and WT mice at different dpi of EAE, as assessed by flow cytometry. Data shown are the mean ± SEM of 3–6 animals per time point and representative of n = 3 independent experiments. (F) Prevalence of M1 monocytes/macrophages relative to M2 subtype isolated from the CNS of WT and ALCAM KO mice at different dpi of EAE, as assessed by their expression of CD11b, CD43, CD206, Ly6C, IL-10, and IL-12 by flow cytometry. Data shown are the mean ± SEM of 4–10 animals per time point pooled from three independent experiments. (G) Immunofluorescent staining of laminin (green), TOPRO-3 (nuclei, blue), and CD4 or F4/80 (red) in spinal cord sections of ALCAM KO and WT mice at day 12 postinduction of EAE. (Scale bar, 100 µm.) Images shown are representative of nine sections per animal and representative of n = 4 animals per group. (H) Absolute numbers of CD4+ T lymphocytes and F4/80+ macrophages observed per lesion. n = 10–15 lesions assessed from three animals per group. *P ≤ 0.05, ***P ≤ 0.001.

