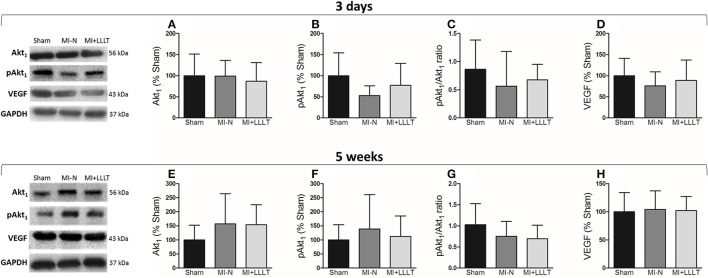
Figure 5.
The protein expression by western blot in the remote myocardium with 3 days and 5 weeks after MI. (A,E) Protein expression of Akt1. (B,F) Protein expression of pAkt1. (C,G) Ratio of pAkt1/ Akt1. (D,H) Protein expression of VEGF. All values were normalized to levels of GAPDH (Sham, n = 8; MI-N, n = 7; MI+LLLT, n = 6). Data are means ± SD. P-values were determined by one-way ANOVA and post hoc Newman-Keuls test.

