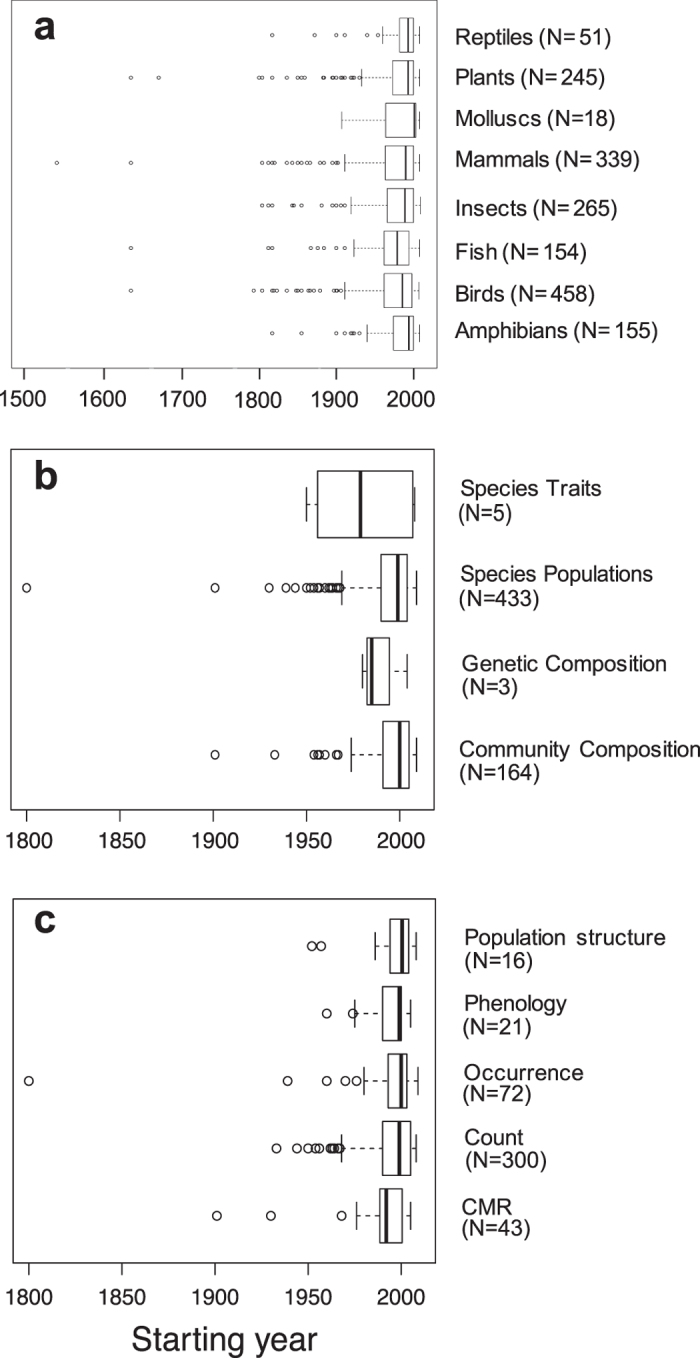
Figure 2.

Univariate boxplots based on the starting year of biodiversity monitoring schemes in Europe for each of (a) the taxonomic groups studied (from entire database), (b) the EBV classes targeted and (c) the type of data collected (from reduced dataset using DaEuMon only; see Methods).
