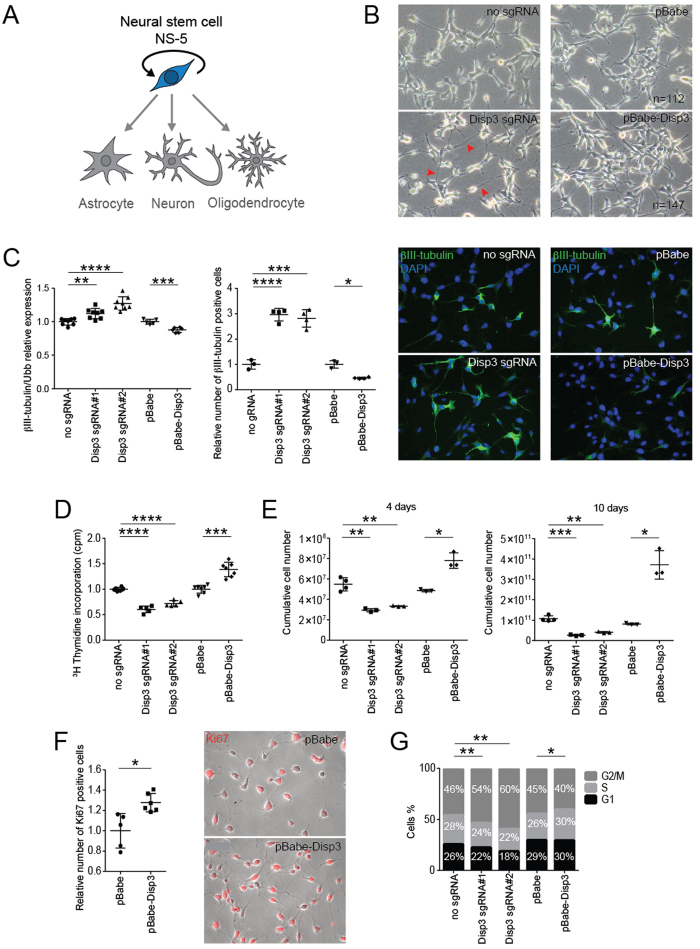
Figure 3. Modulation of DISP3 expression results in changes to undifferentiated NS-5 cells.
(A) Under particular conditions, NS-5 cells are capable of self-renewal. (B) Modulation DISP3 expression leads to morphological changes in undifferentiated NS-5 cells. Representative phase-contrast images of Disp3 sgRNA, pBabe-Disp3 and relevant control cells are shown. Note the prolonged processes observed in Disp3 sgRNA cells (red arrows). (C) βIII-tubulin expression in Disp3 sgRNA, pBabe-Disp3 and control cells was quantified by qRT-PCR analysis (left scatter plot, Ubb was used as a reference gene) and by the Operetta High-Content Imagining System followed by Columbus software analysis (right scatter plot). According to the intensity of staining, cells were divided into three groups: cells with basal, medium and high intensity of βIII-tubulin staining. This analysis shows the fraction of βIII-tubulin-positive cells with the staining intensity exceeding the basal level and normalized to the number of total cells (nuclei). Representative immunofluorescent images of cells stained with βIII-tubulin (green) and DAPI (blue) are also shown. All data represent the mean of biological replicates with error bars indicating standard deviation and the level of statistical significance (*P < 0.05, **P < 0.01, ***P < 0.001, ****P < 0.0001). Mean values - left scatter plot: no sgRNA = 1.00, Disp3 sgRNA#1 = 1.12, Disp3 sgRNA#2 = 1.27, pBabe = 1.00, pBabe-Disp3 = 0.88; - right scatter plot: no sgRNA = 1.00, Disp3 sgRNA#1 = 2.97, Disp3 sgRNA#2 = 2.82, pBabe = 1.00, pBabe-Disp3 = 0.46. (D) Proliferation of Disp3 sgRNA, pBabe-Disp3 and control cells was measured by 3H-thymidine incorporation assays. All data represent the mean of biological replicates with error bars indicating standard deviation and the level of statistical significance (***P < 0.001, ****P < 0.0001). Mean values: no sgRNA = 1.00, Disp3 sgRNA#1 = 0.60, Disp3 sgRNA#2 = 0.72, pBabe = 1.00, pBabe-Disp3 = 1.39. (E) Disp3 sgRNA, pBabe-Disp3 and control cells were counted every other day. The growth rate was plotted as cumulative cell numbers. All data represent the mean of biological replicates with error bars indicating standard deviation and the level of statistical significance (*P < 0.05, **P < 0.01, ***P < 0.001). Mean values - left scatter plot (4 days): no sgRNA = 5.48 × 10⁷, Disp3 sgRNA#1 = 2.94 × 10⁷, Disp3 sgRNA#2 = 3.33 × 10⁷, pBabe = 4.86 × 10⁷, pBabe-Disp3 = 7.81 × 10⁷; - right scatter plot (10 days): no sgRNA = 1.07 × 10¹¹, Disp3 sgRNA#1 = 0.27 × 10¹¹, Disp3 sgRNA#2 = 0.41 × 10¹¹, pBabe = 0.81 × 10¹¹, pBabe-Disp3 = 3.72 × 10¹¹. (F) Operetta High-Content Imaging System quantification of Ki-67 staining (left) and representative immunofluorescence images of pBabe-Disp3 and control cells stained with Ki-67 (red, right). All data represent the mean of biological replicates with error bars indicating standard deviation and the level of statistical significance (*P < 0.05). Mean values: pBabe = 1.00, pBabe-Disp3 = 1.28. (G) The effect of modified DISP3 expression on cell cycle progression was determined by flow cytometry analysis. The percentage of cells in the G1, S and G2/M phases of the cell cycle was counted and plotted. All data represent the mean of biological replicates, the level of statistical significance shows changes in the percentage of cells in the G2/M phase (*P < 0.05, **P < 0.01).

