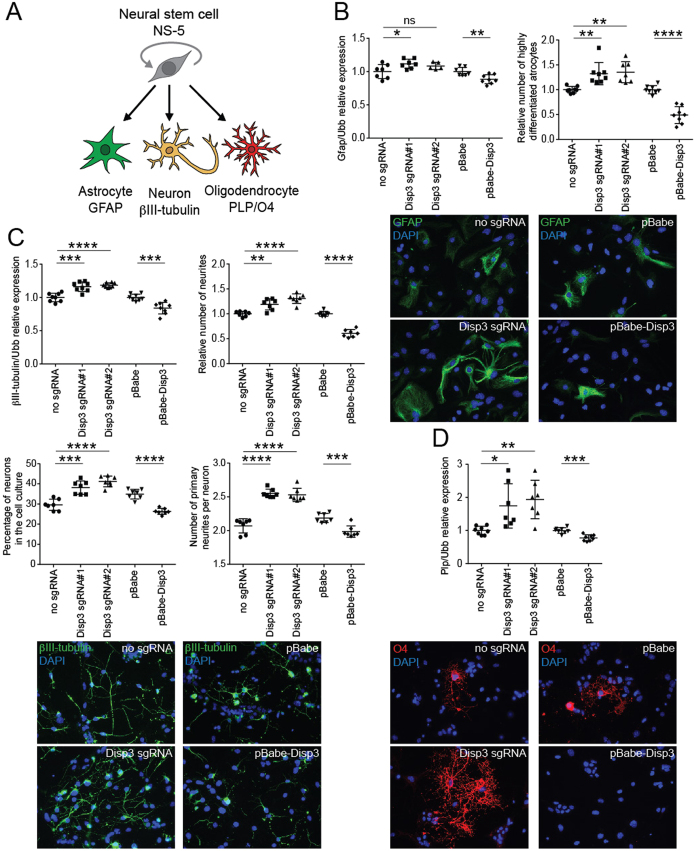
Figure 4. Changes in DISP3 expression levels affect NS-5 differentiation patterns.
(A) Multipotent neural stem cells NS-5 give rise to astrocytes, neurons and oligodendrocytes. Cell type-specific markers GFAP (astrocytes), βIII-tubulin (neurons) and O4 (oligodendrocytes) were analyzed. (B) qRT-PCR analysis of Gfap mRNA expression (left scatter plot, Ubb was used as a reference gene) and GFAP staining of cells after astrocyte differentiation analyzed by the Operetta High-Content Imagining System followed by Columbus software analysis (right scatter plot). This analysis shows the fraction of highly differentiated astrocytes, which were recognized and quantified based on their shape, size, and intensity of staining and normalized to the number of total cells (nuclei). Representative immunofluorescent images of cells stained with GFAP (green) are shown. All data represent the mean of biological replicates with error bars indicating standard deviation and the level of statistical significance (*P < 0.05, **P < 0.01, ****P < 0.0001). Mean values - left scatter plot: no sgRNA = 1.00, Disp3 sgRNA#1 = 1.12, Disp3 sgRNA#2 = 1.08, pBabe = 1.00, pBabe-Disp3 = 0.88; - right scatter plot: no sgRNA = 1.00, Disp3 sgRNA#1 = 1.32, Disp3 sgRNA#2 = 1.35, pBabe = 1.00, pBabe-Disp3 = 0.49. (C) qRT-PCR analysis of βIII-tubulin mRNA expression (upper left scatter plot, Ubb was used as a reference gene) and the numbers of βIII-tubulin-stained neurites (upper right scatter plot) after neuronal differentiation counted by the Operetta High-Content Imagining System followed by Columbus software analysis using the neurite finding tool. The analysis shows the relative number of neurites normalized to the number of total cells (nuclei). The lower left scatter plot displays the percentage of neurons in each cell culture analyzed manually with ImageJ. The lower right scatter plot shows the number of primary neurites recalculated per neuron. All data represent the mean of biological replicates with error bars indicating standard deviation and the level of statistical significance (**P < 0.01, ***P < 0.001, ****P < 0.0001). Representative immunofluorescent images of cells stained with βIII-tubulin (green) are shown at the bottom. Mean values - upper left scatter plot: no sgRNA = 1.00, Disp3 sgRNA#1 = 1.16, Disp3 sgRNA#2 = 1.19, pBabe = 1.00, pBabe-Disp3 = 0.84; - upper right scatter plot: no sgRNA = 1.00, Disp3 sgRNA#1 = 1.19, Disp3 sgRNA#2 = 1.31, pBabe = 1.00, pBabe-Disp3 = 0.61; - lower left scatter plot: no sgRNA = 29.56, Disp3 sgRNA#1 = 38.13, Disp3 sgRNA#2 = 41.19, pBabe = 34.91, pBabe-Disp3 = 26.33; - lower right scatter plot: no sgRNA = 2.07, Disp3 sgRNA#1 = 2.55, Disp3 sgRNA#2 = 2.53, pBabe = 2.18, pBabe-Disp3 = 1.99. (D) qRT-PCR analysis of Plp mRNA expression after oligodendrocyte differentiation. Ubb was used as a reference gene. Representative immunofluorescent images of cells stained with O4 (red) are shown. All data represent the mean of biological replicates with error bars indicating standard deviation and the level of statistical significance (*P < 0.05, **P < 0.01, ***P < 0.001). Mean values: no sgRNA = 1.00, Disp3 sgRNA#1 = 1.74, Disp3 sgRNA#2 = 1.93, pBabe = 1.00, pBabe-Disp3 = 0.78.

