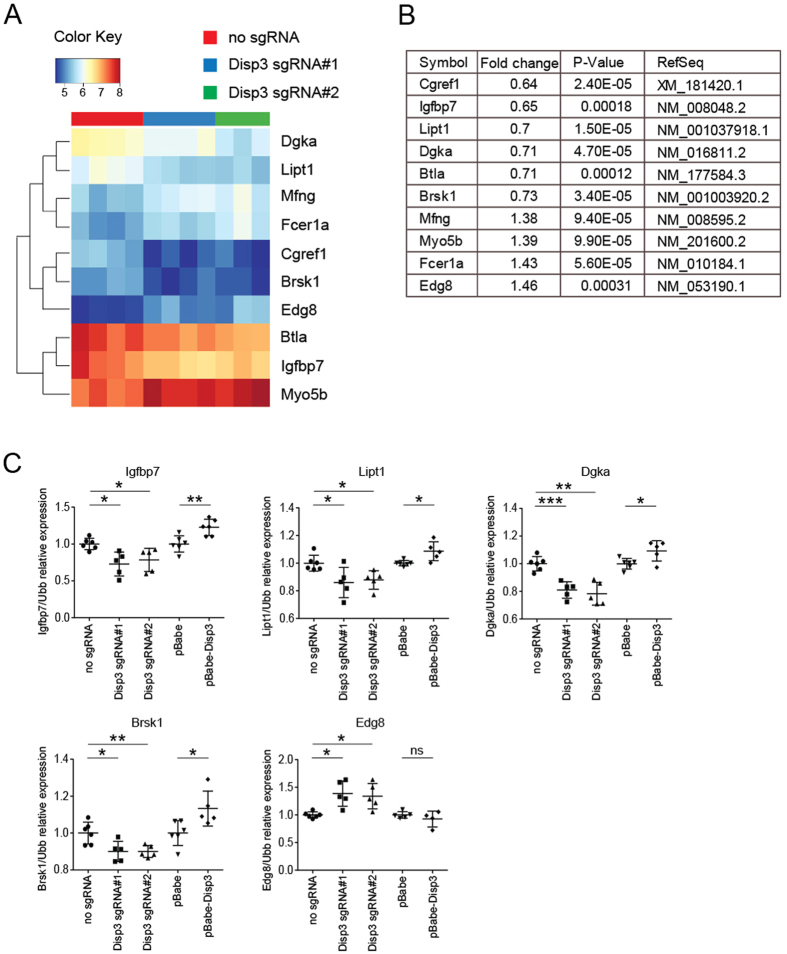
Figure 5. Disp3 gene expression modulation alters gene expression in NS-5 cells.
A heatmap (A) and a list of genes (B) with altered expression in Disp3 sgRNA cells relative to control cells was obtained by microarray expression profiling. (C) Relative expression of identified genes in Disp3 sgRNA, pBabe-Disp3 and control cells was confirmed by an independent qRT-PCR experiment. Ubb was used as a reference gene. Data represent the mean of biological replicates with error bars indicating standard deviation and the level of statistical significance (*P < 0.05, **P < 0.01, ***P < 0.001). Mean values - Igfbp7: no sgRNA = 1.00, Disp3 sgRNA#1 = 0.73, Disp3 sgRNA#2 = 0.78, pBabe = 1.00, pBabe-Disp3 = 1.23; - Lipt1: no sgRNA = 1.00, Disp3 sgRNA#1 = 0.86, Disp3 sgRNA#2 = 0.87, pBabe = 1.00, pBabe-Disp3 = 1.09; - Dgka: no sgRNA = 1.00, Disp3 sgRNA#1 = 0.81, Disp3 sgRNA#2 = 0.78, pBabe = 1.00, pBabe-Disp3 = 1.09; - Brsk1: no sgRNA = 1.00, Disp3 sgRNA#1 = 0.90, Disp3 sgRNA#2 = 0.90, pBabe = 1.00, pBabe-Disp3 = 1.13; - Edg8: no sgRNA = 1.00, Disp3 sgRNA#1 = 1.39, Disp3 sgRNA#2 = 1.34, pBabe = 1.00, pBabe-Disp3 = 0.93.

