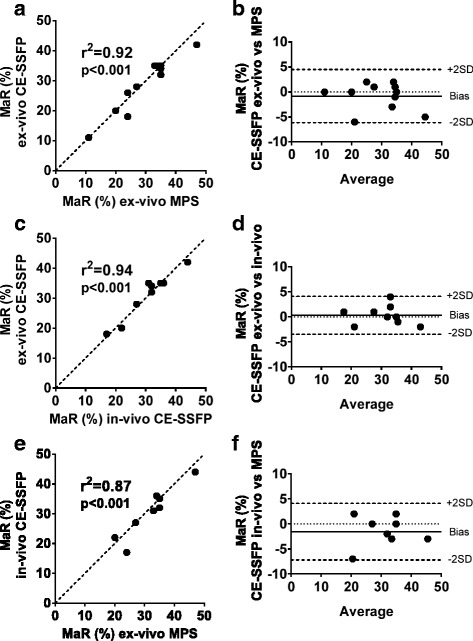
Fig. 2.

Myocardium at risk (MaR) by MRI and MPS show overall good correlation and agreement. Panel a shows a good correlation between MaR by ex-vivo CE-SSFP and MaR by myocardial perfusion SPECT (MPS). The corresponding Bland-Altman plot in panel b shows a low bias. Panel c shows a good correlation between MaR by ex-vivo CE-SSFP and MaR by in-vivo CE-SSFP, with a low bias (panel d). Panel e shows a good correlation between MaR by in-vivo CE-SSFP and MaR by MPS. The corresponding Bland-Altman plot in panel f shows a low bias. In all cases, MaR is expressed as percent of left ventricular mass. The dotted lines in a, c and e represent the line of identity
