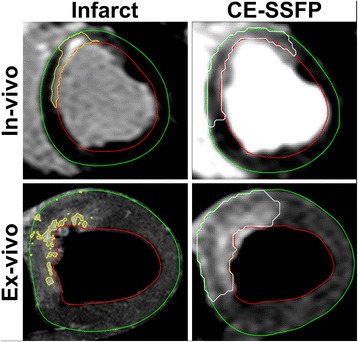
Fig. 3.

Infarct and myocardium at risk (MaR) in vivo and ex vivo. The upper row shows infarct by late gadolinium enhancement (LGE) and MaR by CE-SSFP in vivo and the lower row shows infarct by high-resolution T1-weighted imaging and MaR by CE-SSFP ex vivo. Note the significantly larger MaR compared to infarction both in vivo and ex vivo
