Fig. 2.

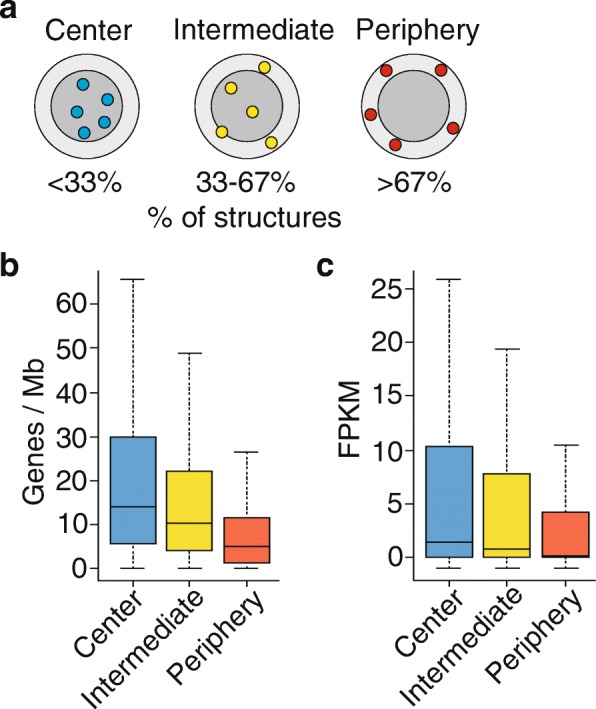
Characterization of TADs modeled at the NP and in the nucleus center. a Definition of periphery, center, and intermediate regions used to ascribe a radial position of TADs in Chrom3D structures. Volumes of the peripheral 1 μm thick “shell” (light gray) (NP) and of the nucleus “core” (dark gray) are equal, given a nucleus of 5 μm radius. A TAD is assigned to the NP if placed in the shell in > 67% of 400 structures, to an “intermediate” location if placed in the shell in 33–67% of the structures, and to the center if placed in the shell in < 33% of the structures. b Gene density and (c) gene expression level in TADs positioned at the periphery, center, or intermediate regions across 400 structures. FPKM values in (c) are from RNA-sequencing data downloaded from NCBI GEO accession number GSE33480
