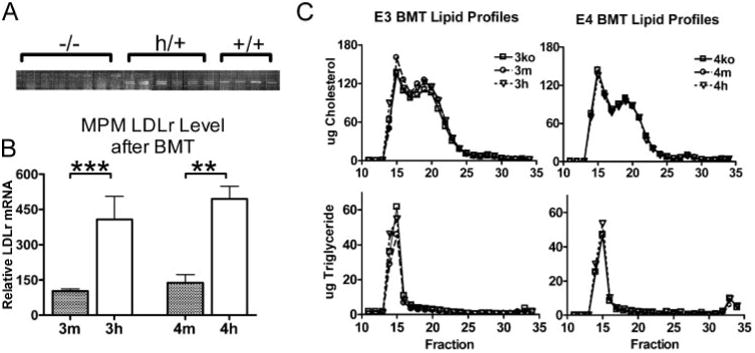
Figure 5. Bone marrow transfer.

A, verification of bone marrow engraftment. DNA was isolated from buffy coat cells of recipient mice, and LDLr genotype was determined by multiplex PCR. The first seven lanes were recipients of ko cells showing a single PCR fragment. The next six lanes were recipients of hLdlr cells showing two bands; the upper band corresponds to the wild type mouse Ldlr allele, and the lower band corresponds to the hLdlr allele. The last four lanes are recipients of m-Ldlr cells showing only the wild type allele. No bands corresponding to the ko allele were detected in the recipients of h or m cells. B, macrophage LDLr mRNA level. Thioglycolate-elicited peritoneal cells were collected from bone marrow transfer recipients. Real time quantitative PCR was used for LDLr mRNA levels using exon 1 sequence that is common to hLdlr and wild type alleles. Averages from mice are shown relative to the expression of 3m donor. **, p ≤ 0.005; ***, p ≤ 0.0005. C, lipoprotein distribution in plasma isolated from the 3ko or 4ko recipient mice that received BM cells with different LDLr expression levels. Plasma (100 μl) pooled from at least five mice of each group was size-fractionated on a fast protein liquid chromatography Superose 6 column, and the cholesterol and triglyceride contents of each fraction were measured with an enzymatic assay.
