
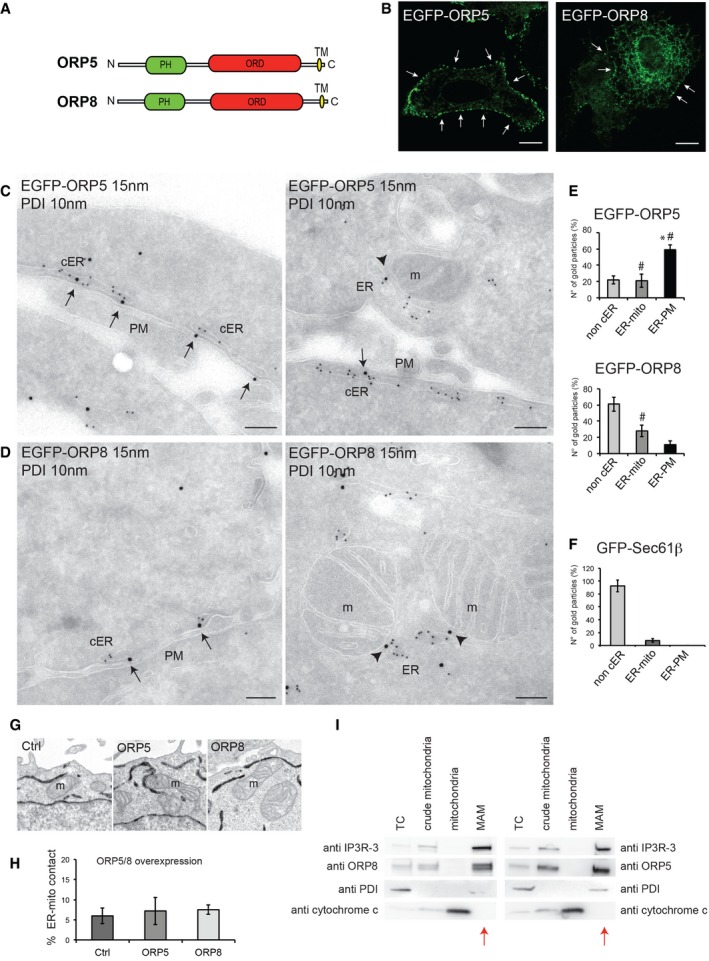
Figure 1. ORP5 and ORP8 localize at ER–PM and ER–mitochondria contact sites.
-
ADomain structures of human ORP5 and ORP8. PH, Pleckstrin homology domain; ORD, OSBP‐related lipid‐binding domain; TM, transmembrane domain.
-
BConfocal images of HeLa cells transfected with EGFP‐ORP5 or EGFP‐ORP8 showing variable expression levels. Arrows indicate ORP5 and ORP8 localization to cortical ER (cER). Scale bar, 10 μm.
-
C, DElectron micrographs of ultrathin cryosections of HeLa cells transfected with EGFP‐ORP5 or EGFP‐ORP8 and immunogold stained with anti‐GFP (15 nm gold) to detect ORP5 or ORP8 and anti‐PDI (10 nm gold) to label the ER lumen. ORP5 and ORP8 localize at ER–PM (arrows) and ER–mitochondria contact sites (arrowheads). m, mitochondria; cER, cortical ER; PM, plasma membrane. Scale bar, 200 nm.
-
E, FQuantification of the IEM labeling for EGFP‐ORP5, EGFP‐ORP8 (E), and GFP‐Sec61β (F) in transfected HeLa cells. Results are presented as the percentage of the total number of gold particles (800 per condition, n = 35–45 cells) for ORP5, ORP8, and Sec61β in the indicated compartments (non‐cER, non‐cortical ER; ER‐PM, ER–PM contact sites; ER‐mito, ER–mitochondria contact sites). % gold particles ± SEM. Data are the mean of three independent replicates. *P < 0.001 compared to non‐cER and ER‐mito (EGFP‐ORP5) and to ER‐PM and ER‐mito (EGFP‐ORP8 and GFP‐Sec61β), # P < 0.001 compared to ER‐PM and ER‐mito (GFP‐Sec61β).
-
G, HRepresentative electron micrographs of mitochondria (G) and quantification of the percentage of ER–mitochondria contact sites (ER‐mito contact) per mitochondria (H) of HeLa cells expressing EGFP‐ORP5, EGFP‐ORP8 together with HRP‐KDEL, to visualize the ER. Control (Ctrl) consisted of HeLa cells overexpressing only HRP‐KDEL. % ER–mitochondria contact sites ± SEM. Data are representative of three independent replicates.
-
ICrude mitochondria, mitochondria, and MAM fractions were purified from HeLa cells, and equal amounts of protein (25 μg) from each fraction were loaded on a 4–20% gradient SDS–PAGE gel and immunoblotted using anti‐ORP5, anti‐ORP8 and anti‐IP3R‐3 (MAM protein), anti‐PDI (ER protein), and anti‐cytochrome c (mitochondrial protein). Red arrows indicate the MAM fraction lane. TC, total cell; MAM, mitochondria‐associated ER membrane
Source data are available online for this figure.