
Figure 4. Depletion of ORP5 affects mitochondria morphology and function.
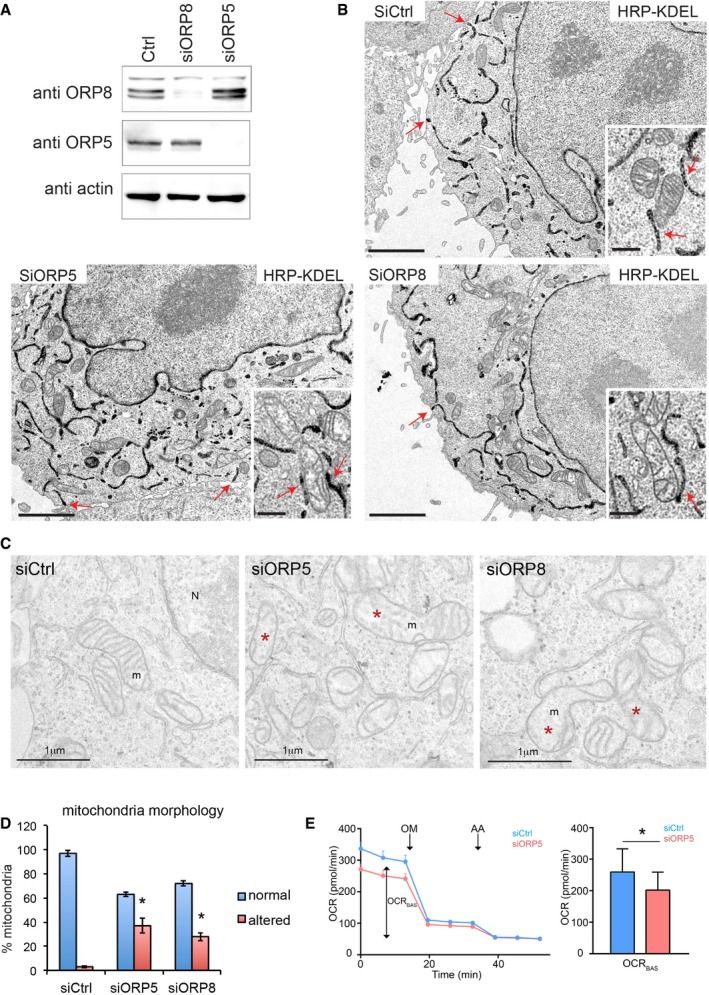
- ORP5, ORP8, and actin levels of HRP‐KDEL‐expressing HeLa cells treated with Ctrl siRNAs (siCtrl) or siRNAs against ORP5 (siORP5) or ORP8 (siORP8).
- Electron micrographs of HRP‐KDEL‐expressing HeLa cells treated with Ctrl siRNAs or siRNAs against ORP5 or ORP8. Red arrows indicate ER–PM contact sites. Scale bar, 2 μm. Insets show representative mitochondria and red arrows in the insets indicate ER–mitochondria contacts. Inset scale bar, 500 nm.
- Representative EM micrographs showing the morphology of mitochondria in siCtrl‐, siORP5‐, and siORP8‐treated cells. Scale bar, 1 μm. Red asterisks indicate mitochondria with altered morphology.
- Quantifications of the number of mitochondria with altered morphology in the indicated siRNA conditions. % altered mitochondria ± SEM, n = 25 cells, and 632–710 mitochondria. *P < 0.001 compared to siCtrl.
- Mitochondrial oxygen consumption rate (OCR) measured in Ctrl and ORP5 siRNA‐transfected cells. OCR trace was obtained by sequential measurement of basal OCR (OCRBAS), OCR after the addition of oligomycin (OM), and OCR after addition of antimycin A (AA). Note the reduced basal OCR (OCRBAS) compared to ctrl siRNA cells. Error bars denote ± SEM. Data are the mean of 4 independent repeats (n = 4), *P < 0.05.
Source data are available online for this figure.