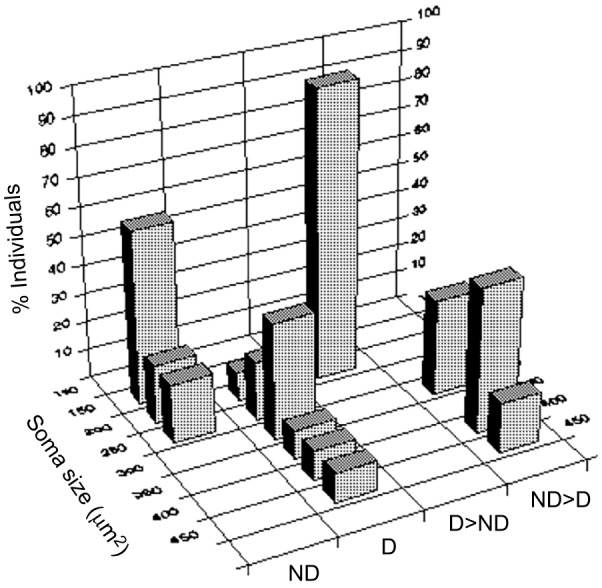
Fig. 2.

Three-dimensional plot of mean soma diameter of preoptic area irGnRH1 neurons in males of different social status. There are significant differences between dominant (D) and D→non-dominant (ND) males and between ND and ND→D males. Soma size is a proxy for gonadotropin releasing hormone 1 (GnRH1) abundance. The percentage of individuals with mean soma size in a given size bin is plotted for each treatment condition. Redrawn from Francis et al. (1993).
