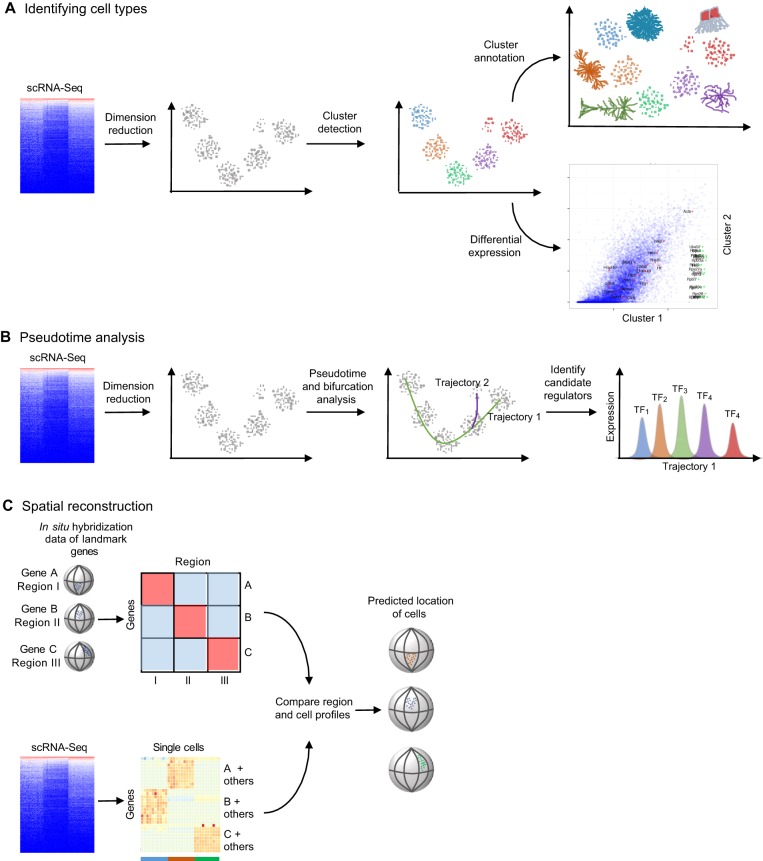
Fig. 2.
Typical approaches for analyzing scRNA-Seq datasets. Several types of analyses are popular for analyzing scRNA-Seq datasets. (A) When trying to identify cell types, dimension reduction techniques such as independent component analysis, principal component analysis, t-distributed stochastic neighbor embedding, ZIFA (Pierson and Yau, 2015) or weighted gene co-expression network analysis (Langfelder and Horvath, 2008) are first used to project high-dimensional data into a smaller number of dimensions to ease visual evaluation and interpretation. Clusters of similar cells can be identified using generally applicable methods, such as Gaussian mixture modeling (Fraley and Raftery, 2002) or K-means clustering, or methods devised specifically for single cell data, such as StemID (Grün et al., 2016), SCUBA, SNN-Cliq (Xu and Su, 2015), Destiny (Angerer et al., 2015) or BackSpin (Zeisel et al., 2015). Clusters can then be annotated based on domain-specific knowledge of the expression of a few genes, or automatically based on gene set enrichment. Finally, specific genes that are differentially expressed between clusters can be identified using scRNA-Seq-specific methods such as SCDE (Kharchenko et al., 2014) and MAST (Finak et al., 2015). (B) Most pseudotime analyses (which place each cell on a statistically derived axis that represents progression along a process, such as developmental time) start by performing dimension reduction. They then determine trajectories through the reduced dimensionality data; some algorithms identify bifurcation points and generate a distinct trajectory. The trajectories can then be used to order single cells along the process and to identify candidate regulators of stage transitions, for example, by finding stage-specific transcription factors (TF1-TF5). (C) One of the major drawbacks of scRNA-Seq is the loss of spatial context information when cells are dissociated and/or isolated. Spatial reconstruction methods attempt to ameliorate this issue by leveraging prior knowledge of landmark gene expression. Typically, localized expression of select genes is generated from in situ hybridization. Spatial reconstruction algorithms then compare scRNA-Seq profiles to discretized in situ hybridization profiles, and cells are placed in silico in the anatomical region with a matching profile. Machine-learning approaches can be used to estimate the expression of landmark genes to overcome the noisy nature of scRNA-Ssq data.

