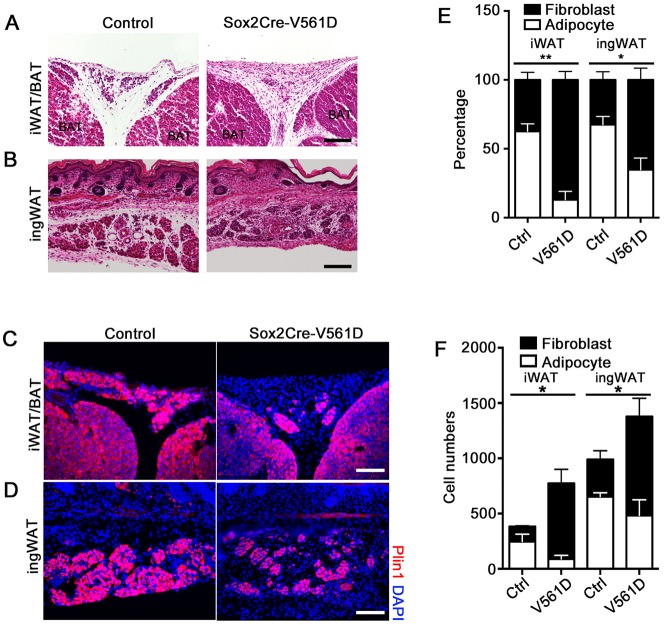
Fig. 5.
Disrupted fibroblast-adipocyte balance in newborn Sox2-V561D mice. (A,B) H&E-stained images of iWAT and ingWAT from a Sox2-V561D mouse and littermate control at P0. (C,D) Immunofluorescence analysis of iWAT and ingWAT from a Sox2-V561D mouse and littermate control at P0, stained for Plin1. (E) Quantification of the percentage of Plin1+ adipocytes and Plin1neg fibroblasts from iWAT and ingWAT at P0. n=3-4 sections per data point. (F) Quantification of the total number of Plin1+ adipocytes and Plin1neg fibroblasts from iWAT and ingWAT at P0. n=3-4 sections per data point. All data are presented as mean±s.e.m. *P<0.05, **P<0.01, Student's t-test. Scale bars: 100 μm.

