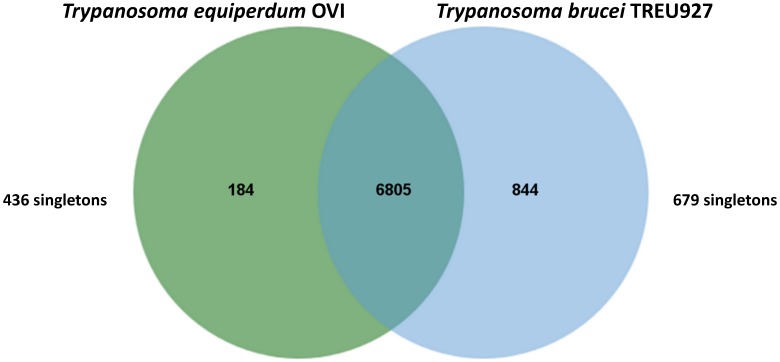
Figure 1.
Venn diagram showing the results of OrthoMCL v1.4 analysis of orthologous CDS between Trypanosoma equiperdum OVI and Trypanosoma brucei TREU927. This Venn diagram show shared and species-specific protein-coding gene clusters in the genomes T. equiperdum OVI (left, green) and Trypanosoma brucei TREU927 (right, blue). Singletons, i.e. genes without orthologs and paralogs in either species, are placed outside the Venn diagram to the left and right.

