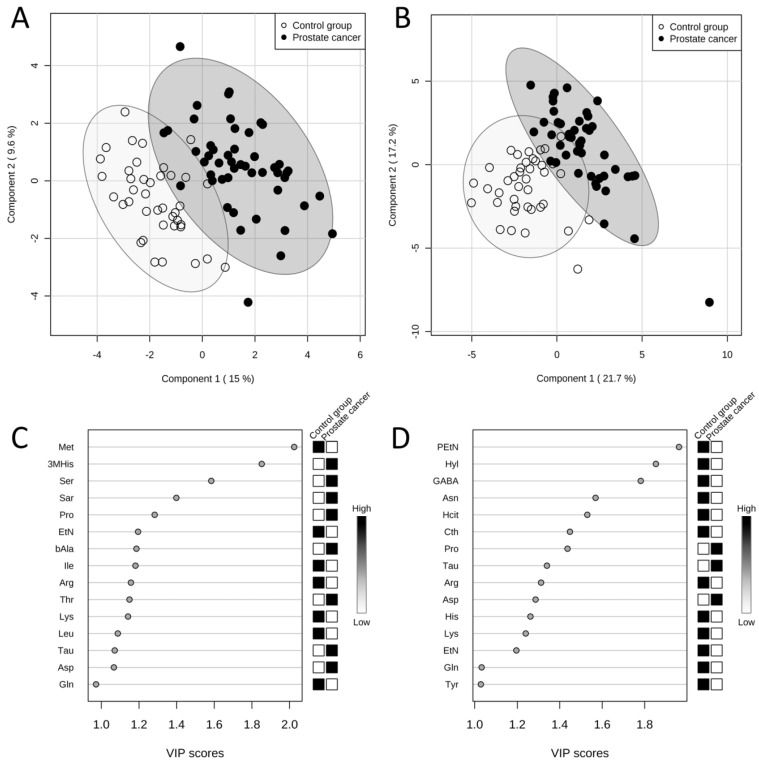
Figure 2.
Results of PLS-DAs of free amino acid profiles. Score plots between first and second latent variables (with explained variances shown in brackets) obtained in PLS-DAs of free amino acid profiles in serum (A) and urine (B) in two studied groups: the prostate cancer group (n = 49, black dots) and the control group (n = 40, white dots). Variable importance in projection (VIP) scores in PLS-DAs of free amino acid profiles in serum (C) and urine (D) in two studied groups: the prostate cancer group (n = 49) and the control group (n = 40). VIP scores for 15 amino acids with the highest contribution of to the separation of the studied groups are presented. The boxes on the right refer to the relative concentrations of the appropriate amino acid in the studied groups. 3MHis - 3-methylhistidine, Arg - arginine, Asn - asparagine, Asp - aspartic acid, bAla - β-alanine, Cth - cystathionine, EtN - ethanolamine, GABA - γ-amino-n-butyric acid, Gln - glutamine, Hcit - homocitrulline, His - histidine, Hyl - δ-hydroxylysine, Ile - isoleucine, Leu - leucine, Lys - lysine, Met - methionine, PEtN - phosphoethanolamine, Pro - proline, Sar - sarcosine, Ser - serine, Tau - taurine, Thr - threonine, Tyr - tyrosine.

