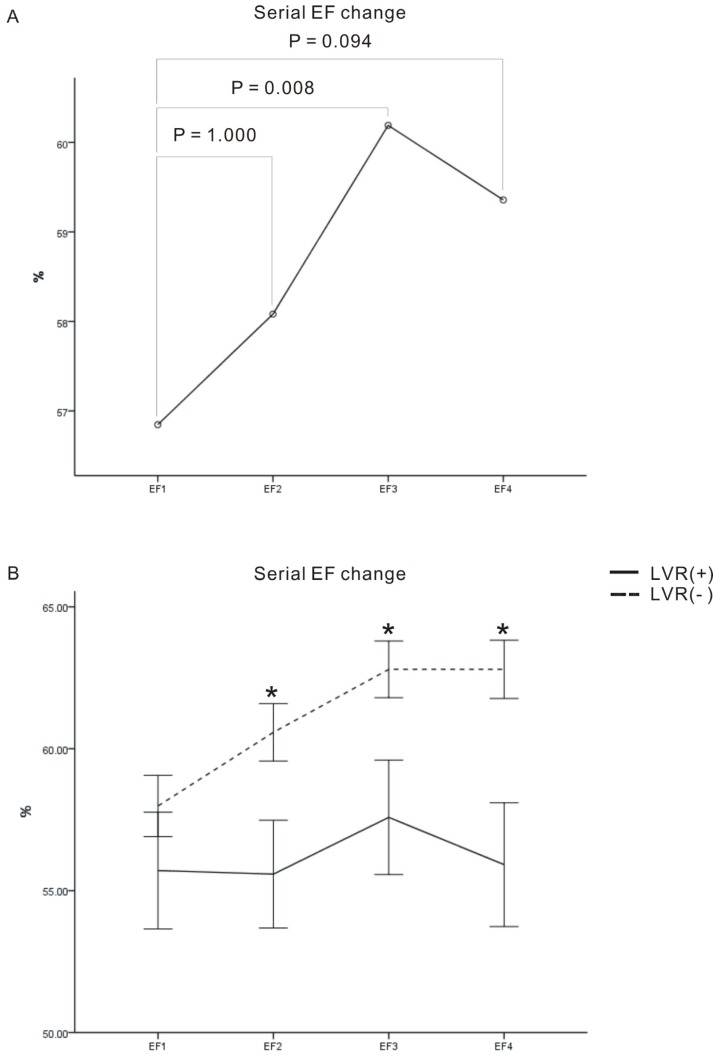
Figure 5.
Serial changes in left ventricle ejection fraction (EF). (A) Serial levels of EF on day-2 (EF1), day-7 (EF2), day-90 (EF3), and day-180 (EF4) (unit: %). Pair comparisons showed significant difference among EF1 and EF3. (B) There were significant between-subject differences in EF2, EF3 and EF4. The serial EFs were presented as mean ± standard error. *p < 0.05 between remodeling and no-remodeling group.

