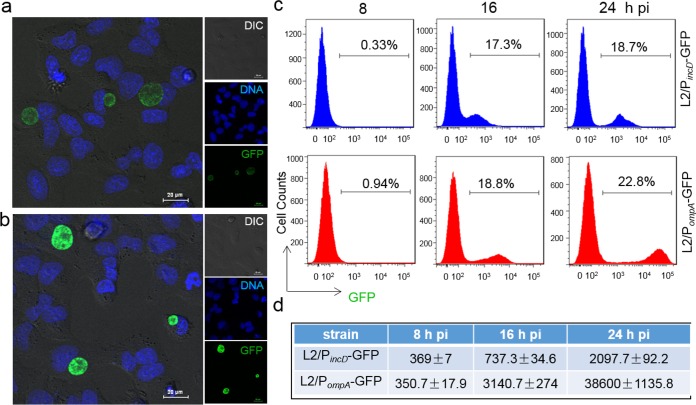
FIG 1.
Performance of C. trachomatis GFP reporter systems. (a and b) Fluorescence microscopy detects GFP-expressing inclusions in HeLa 229 cells infected with L2/PincD-GFP (a) or L2/PompA-GFP (b). Live cells were counterstained for DNA (Hoechst 33342) before visualization. Images were taken at 24 hpi under the same exposure condition for L2/PincD-GFP and L2/PompA-GFP. DIC, differential inference contrast. (c) Quantitative analysis of GFP levels using flow cytometry. Cells (30,000) in each sample were analyzed at the time points indicated. The percentage of GFP-positive cells in each of the samples is shown. (d) MFI obtained from the same samples used in the assay whose results are shown in panel c. Data are representative of those from three independent experiment performed in triplicate for each group. All values were analyzed by FlowJo and GraphPad Prism software.

