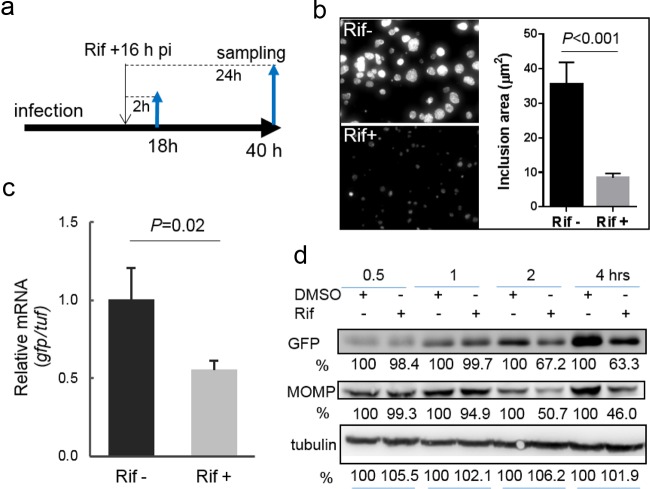
FIG 2.
Changes in chlamydial growth and GFP expression induced by rifampin (Rif). (a to c) Experimental schematic for the time of rifampin addition (a) and sample testing by imaging (b) and qRT-PCR analysis (c). (b) Visualization of the inclusion morphology in the absence or presence of rifampin for 24 h starting at 16 hpi. Images were taken at 40 hpi under the same conditions in the absence and presence of rifampin. The graph on the right shows the average size, determined from five different fields using ImageJ software, of inclusions exposed to rifampin relative to that of inclusions that lacked rifampin exposure. The P value was obtained by an unpaired Student t test. (c) Exposure to rifampin for 2 h resulted in a significant decrease in gfp mRNA levels in C. trachomatis, as measured by qRT-PCR (see Materials and Methods). Shown is the ratio of the level of gfp mRNA to the level of tuf mRNA. The P value was obtained by an unpaired Student t test. (d) Quantifying the levels of MOMP and GFP by immunoblotting. Lysates of cells exposed to rifampin or DMSO (control) were paired. GFP or MOMP was probed with specific antibodies, and their levels were quantified by densitometry using Quantity One software. Host cell tubulin was used as a loading control for protein amounts. The values are reported as a percentage by normalization to the corresponding protein intensity from the DMSO control harvested at the same times. Data are representative of those from three independent experiments. In all cases, rifampin was used at a concentration of 50 ng/ml.

