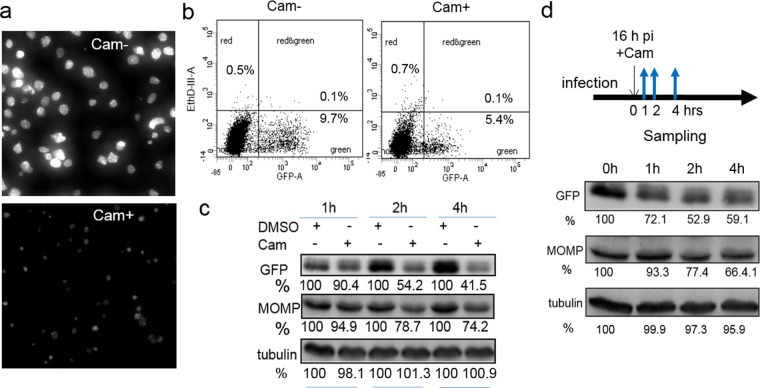
FIG 3.
Chloramphenicol (Cam) affects chlamydial growth and GFP expression. (a) Live cell image of L2/PompA-GFP-infected cells that were and were not exposed to chloramphenicol starting at 16 hpi for 24 h. Images were taken at 40 hpi under the same conditions for cells that were and were not exposed to chloramphenicol. (b) Simultaneous quantification of the GFP-positive population and EthD-III-stained dead cells. Cells were harvested after exposure to chloramphenicol (Cam+) for 6 hpi and subjected to flow cytometry. The corresponding cells that lacked exposure to chloramphenicol (Cam−) were harvested at the same time and used as controls. The distribution of cells in the green channel (GFP) and red channel (EthD-III-A) is shown. The percentages of cells displaying no fluorescence (uninfected bystander cells), GFP-positive cells, and/or EthD-III-positive cells relative to the total number of cells initially analyzed are indicated. (c) Measurement of MOMP and GFP levels by immunoblotting. Lysates of L2/PompA-GFP-infected cells exposed to chloramphenicol or DMSO (control) harvested at the same times were compared. GFP, MOMP, or tubulin (loading control) was revealed with specific antibodies. (d) Monitoring of the fate of GFP in C. trachomatis by immunoblotting. Protein bands were quantified by densitometry using Quantity One software. The values are reported as a percentage by normalization of the corresponding protein intensity to that for the DMSO control. Data are representative of those from three independent experiments. In all cases, chloramphenicol was used at a concentration of 60 ng/ml.

