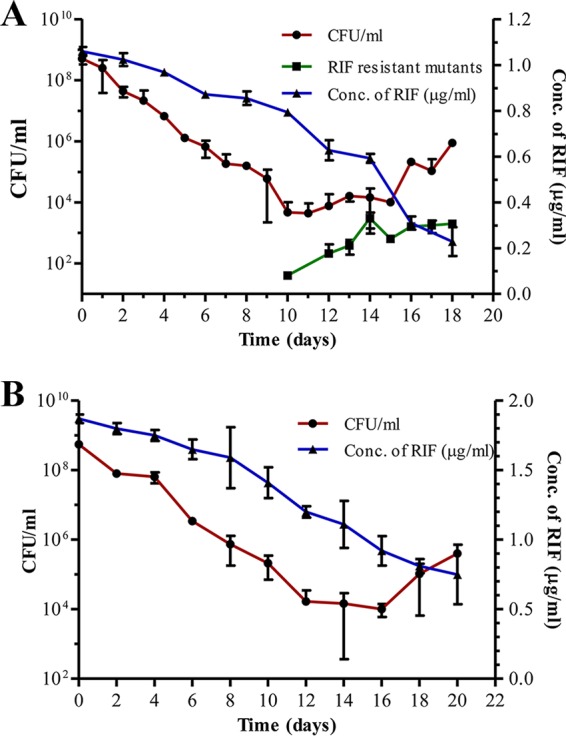
FIG 1.

RIF susceptibility profile of M. tuberculosis cells during extended exposure to lethal concentrations of RIF. (A) RIF susceptibility profile of M. tuberculosis cells exposed to 1 μg/ml (10× MBC) RIF for 18 days when plated on RIF-free plates (•; red line). The CFU of the cells on RIF-containing (50× MBC) plates (■; green line) and the concentration of RIF during the course of the experiment (right y axis; ▲; blue line) are shown. (B) RIF susceptibility profile of M. tuberculosis cells exposed to 2 μg/ml (20× MBC) of RIF (•; red line) and concentration of RIF during the course of the experiment (right y axis; ▲; blue line).
