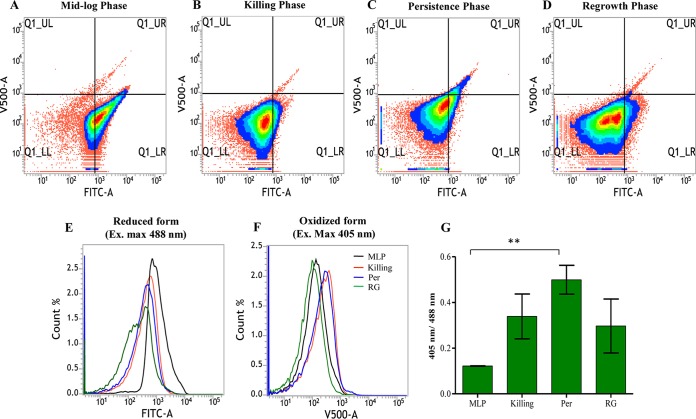
FIG 7.
Detection of oxidative stress status in RIF-exposed M. tuberculosis cells using redox-sensitive roGFP2. (A to D) Representative density plots of the flow cytometry profile of the M. tuberculosis-Mrx1-roGFP2 integrant in the different samples showing redox changes in bacteria during RIF exposure. (E and F) Corresponding histogram overlay of fluorescence from Mrx1-roGFP2 in the reduced and oxidized states. Ex., excitation. (G) Bar graph showing the ratiometric changes in the median values of roGFP2 (excitation at 405 and 488 nm) for the same experiment. Double asterisks indicate a P value of ≤0.01. Statistical significance was calculated using the paired t test.

