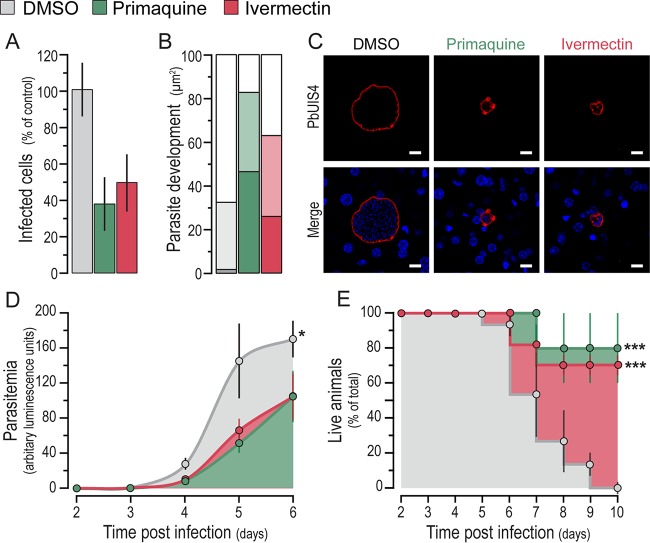
FIG 3.
Ivermectin treatment inhibits parasite development in hepatocytes and improves the outcome of disease. (A) Parasite density per square millimeter of liver section following treatment with ivermectin, primaquine, or the vehicle at 48 hpi. (B) Effect of treatment on the parasite area as a correlate of parasite development at 48 hpi. Darker colors indicate parasite areas of <250 μm2, intermediate shading indicates areas between 250 and 750 μm2, and lighter bars indicate parasite areas of >750 μm2. (C) Representative confocal microscopy images of liver parasites in treated and control mice. Green, PbUIS4 labeling showing the PVM; blue, Hoechst nuclear staining. Scale bars,10 μm. (D) Assessment of the prepatency period and blood parasitemia by bioluminescence assays at various time points after spz administration and drug treatment as in Fig. 2A. The mean bioluminescence ± the standard errors of the pooled data of 15 mice from three biological replicate experiments is presented for each of the time points analyzed. A statistical analysis of the mean parasitemia observed across time was performed by using the nonparametric Friedman test, which indicated a significant difference, with a P value of <0.05 (*). (E) Mouse survival following spz administration and drug treatment as in Fig. 2A. The mean percentage of live animals ± the standard errors of the pooled data of 15 mice from three biological replicate experiments is shown for daily records, starting at the second day after spz administration and drug treatment and up to 10 days pi. The Mantel-Cox (log rank) test was employed to compare survival curves, indicating statistically significant differences, with a P value of <0.001 (***) for both the primaquine- and ivermectin-treated groups compared to the DMSO-treated controls.

