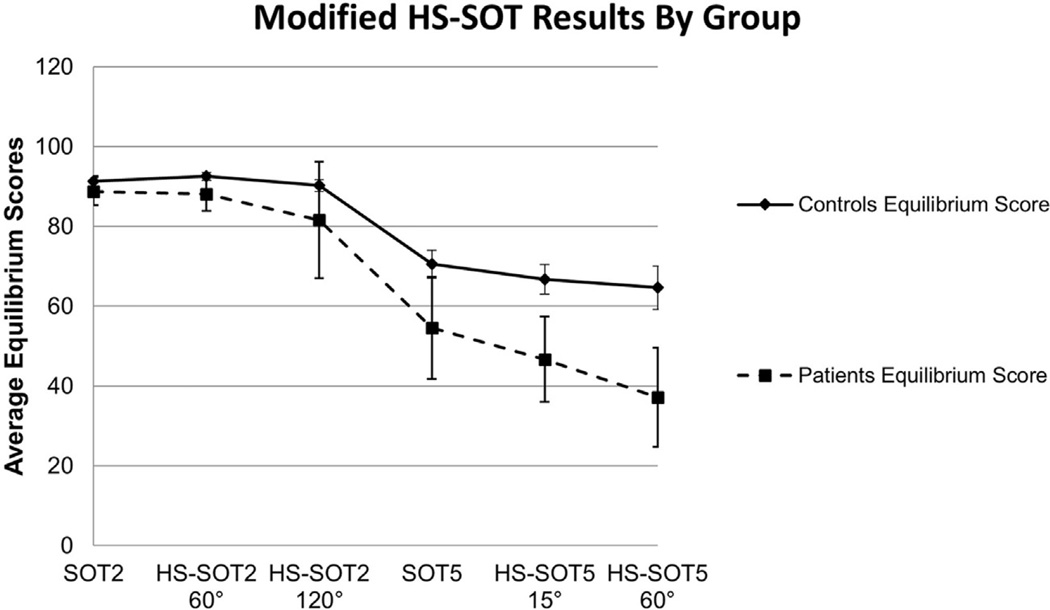
Fig. 2.
Slopes of linear regression best fit lines with 95% confidence interval (CI) bars between condition difficulty rank (condition 1 = SOT 2, condition 2 = HS SOT2–60°/s, condition 3 = HS SOT2–120°/s, condition 4 = SOT 5, condition 5 = HS SOT5–15°/s, condition 6 = HS SOT5–60°/s) equilibrium score for patients (dashed line) and age-matched healthy controls (solid line). A greater decline was noted for the patients (slope = −11.69) as compared to healthy controls (slope = −6.59).

