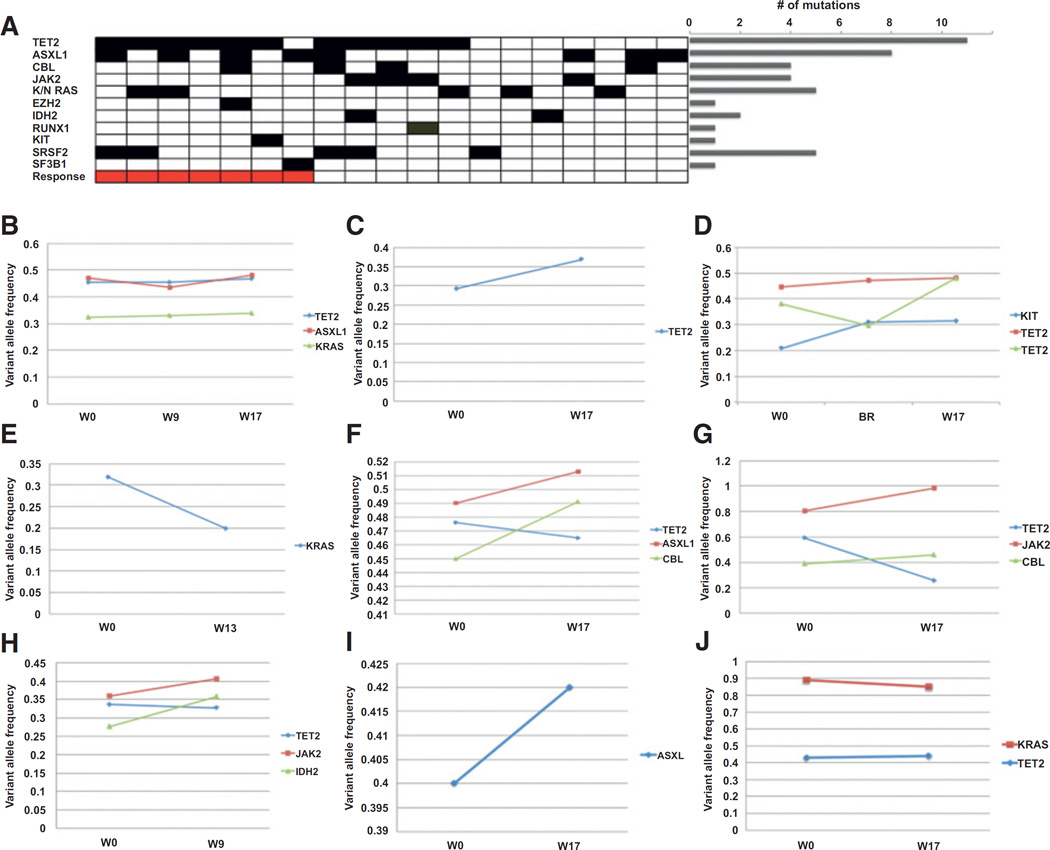
Figure 2.
Mutational profiling of CMML patients treated with ruxolitinib. A, the mutational landscape of CMML patients on trial. Patients are represented in columns and gene mutations in rows. Cases sorted by combined MDS IWG 2006 and spleen response. The number of mutations seen in the entire cohort is denoted in the bar plot (L). B–D, sequential variant allele frequency of responding patients from 0 to 1.00. E–J, sequential variant allele frequency of nonresponding patients. x-axis denotes week (W) and/or best response (BR).

