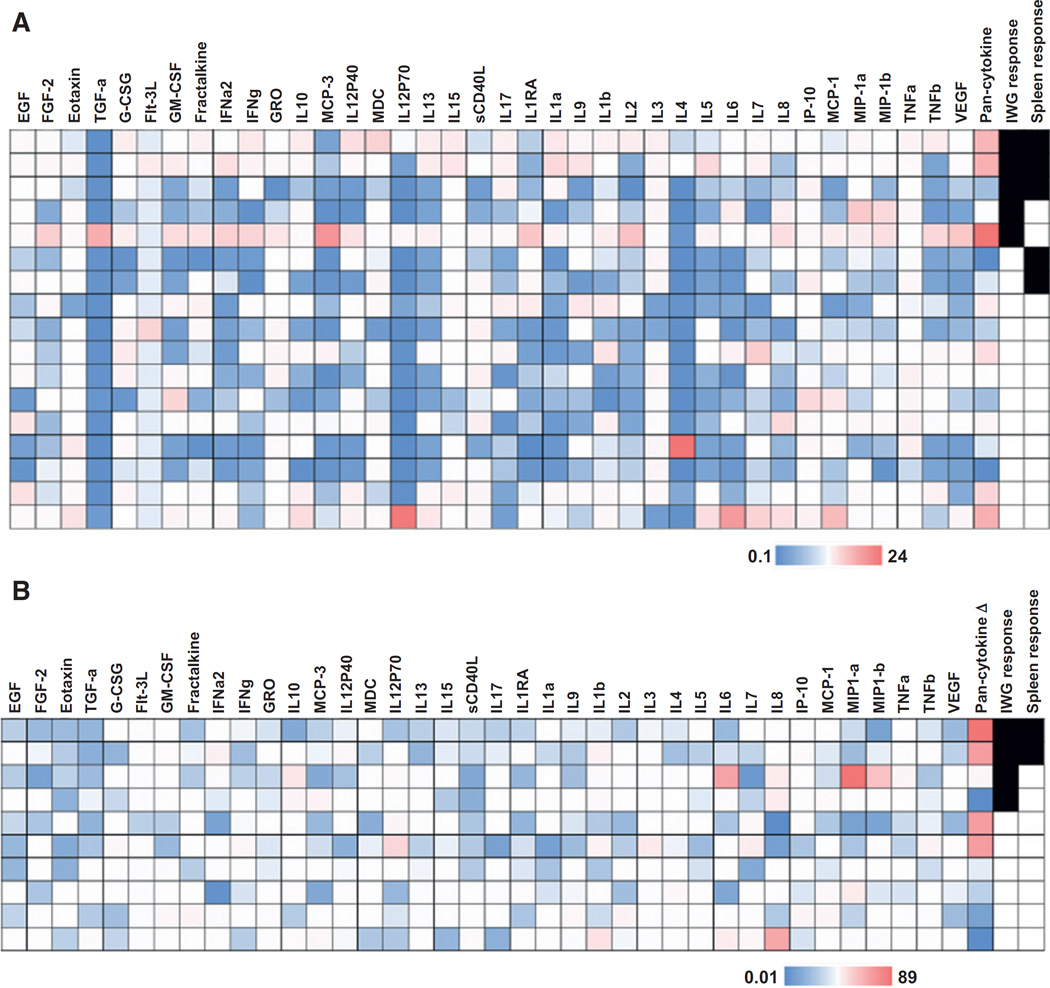
Figure 3.
Inflammatory cytokine profiling of CMML patients treated with ruxolitinib. Heatmap demonstrating cytokine levels in the context of ruxolitinib. Legend is denoted on the figure. Red=higher levels, Blue=lower levels. Cases that achieved an MDS IWG 2006 response and/or spleen response are denoted. A, heatmap demonstrating cytokine levels relative to the mean level of each respective cytokine. "Pan-cytokine" is defined as the number of cytokines elevated above the mean in any given subject (n = 17). B, heatmap demonstrating downregulation of cytokines after week 17 in 10 subjects. "Pan-cytokine Δ" is the number of cytokines downregulated after therapy in any given subject. Those in red had at least 20 cytokines decreased compared with pretreatment levels. Responses denoted as in (A).

