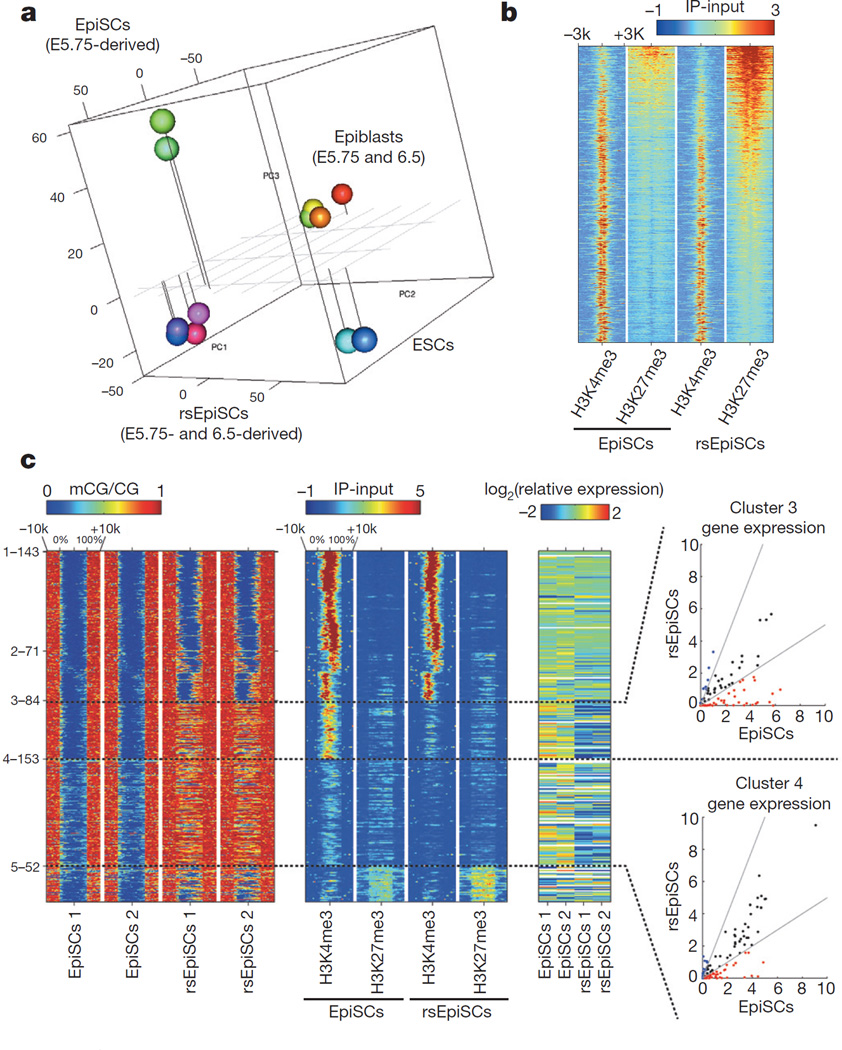
Figure 3. Global transcriptomic and epigenomic analysis.
a, PCA of microarray data generated from ESCs, EpiSCs, rsEpiSCs and isolated epiblasts. b, H3K4me3 and H3K27me3 ChIP-seq signals at Polycomb target genes in EpiSCs and rsEpiSCs. c, Clustering of unmethylated regions associated with promoters that overlap with rsEpiSCs hyper-DMRs. CG methylation (mCG), H3K4me3 and H3K27me3 levels were plotted for scaled unmethylated regions and ± 10 kb regions surrounding the unmethylated regions. Dashed lines in the scatter plot indicate a twofold up (blue) or down (red) difference in RNA level in rsEpiSCs compared to EpiSCs. a, c, n = 2; b, n = 1, biological replicates.

