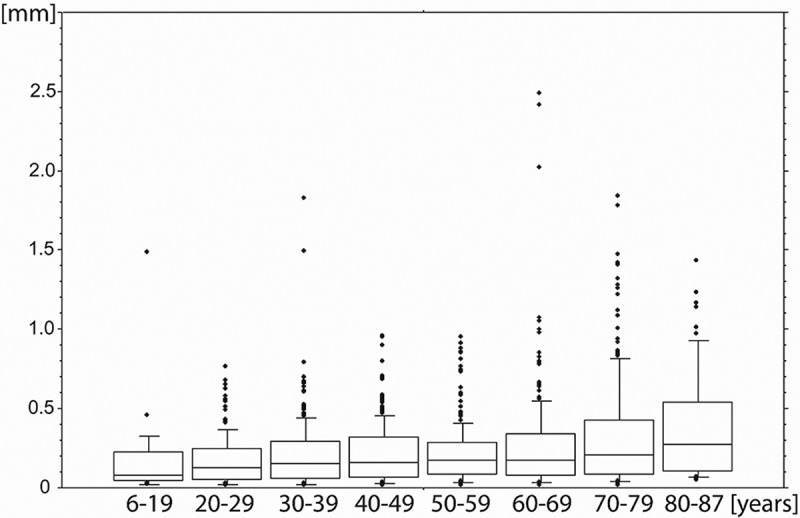
Figure 4.

Box plot showing anisocoria in relation to age with all outliers for all illumination levels. The ordinate shows anisocoria in mm, the abscissa shows eight different subgroups for age decades in years. The whiskers indicate 10% and 90% of data.
