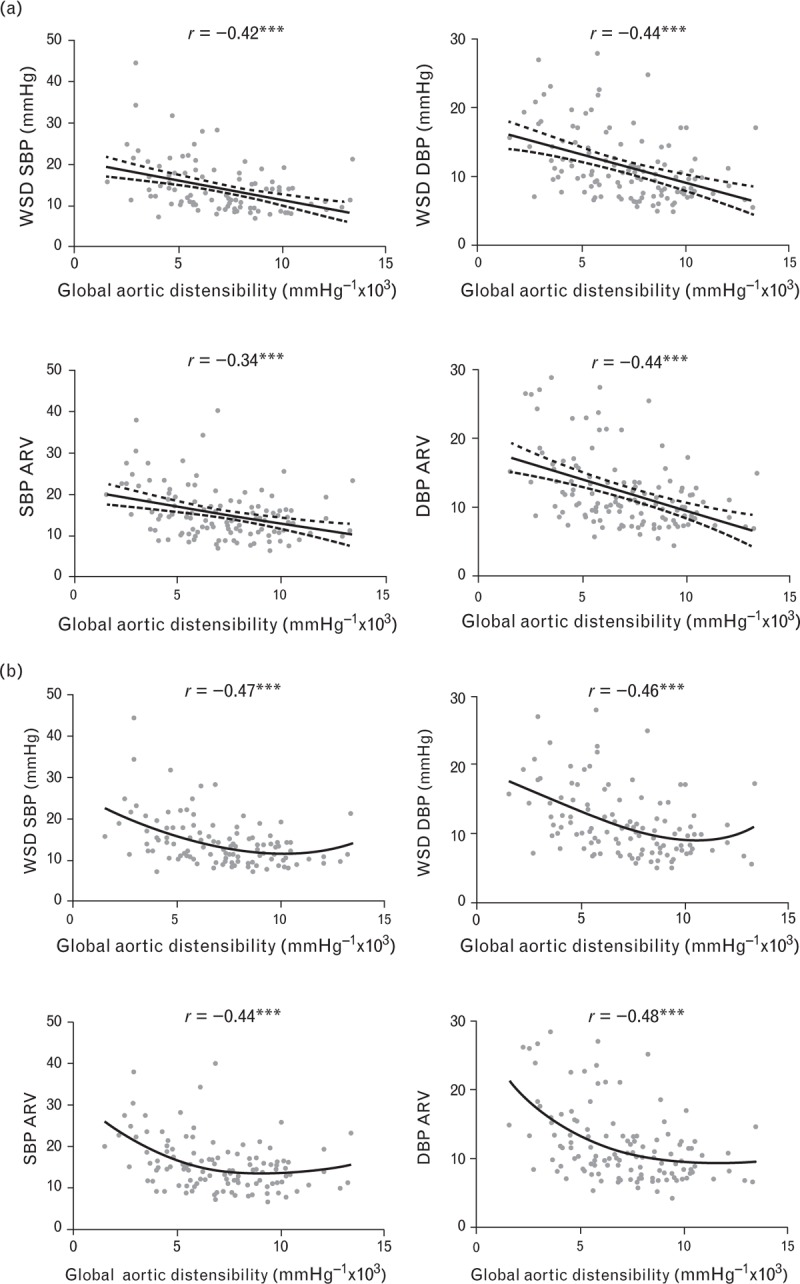
FIGURE 1.

Relations between blood pressure variability and global aortic distensibility. ARV, average real variability, WSD, weighted 24-h SD. (∗∗∗P ≤ 0.001; ∗∗P ≤ 0.01; ∗P < 0.05). Panel (a): linear analysis. Panel (b): nonlinear analysis using cubic model (Y = b0 + (b1 × X) + (b2 × X2) + (b3 × X3).
