Figure 1.

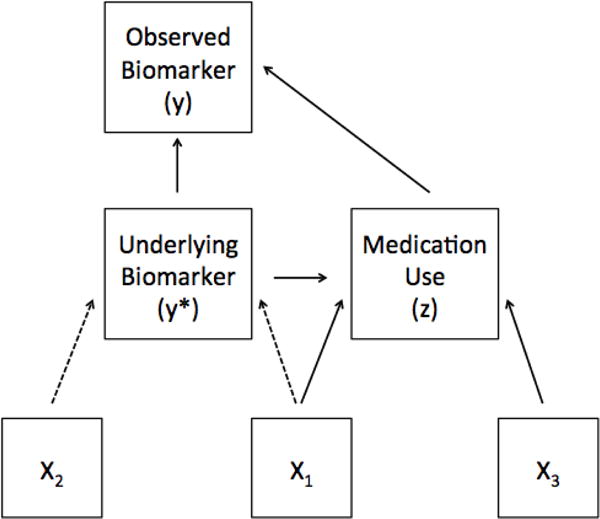
Diagram depicting the presumed data generation mechanism for the Heckman treatment effects model in a cross-sectional setting. All measurements refer to a single point in time. Dashed lines indicate associations of particular interest.

Diagram depicting the presumed data generation mechanism for the Heckman treatment effects model in a cross-sectional setting. All measurements refer to a single point in time. Dashed lines indicate associations of particular interest.