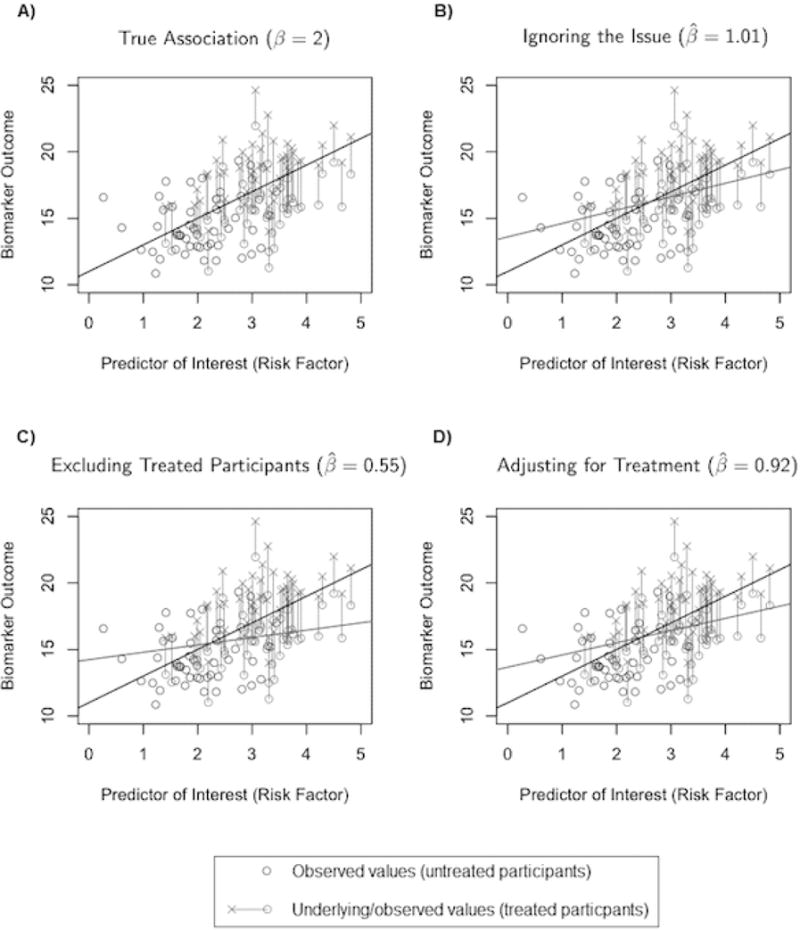
Figure 2.

Observed values for untreated participants are shown as black circles; treated participants are in gray; the observed (o) and treated (×) values are connected with a line. The dark black line signifies the true association of β = 2; the gray lines show the results form three traditional approaches: ignoring the issue (panel B), excluding treated participants (panel C), and adjusting for treatment (panel D).
