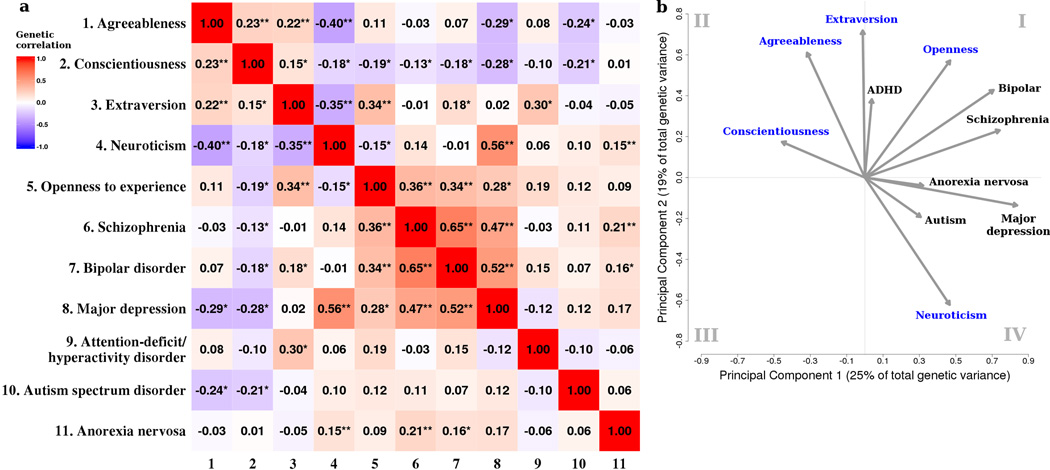
Figure 3. Genetic correlations between personality traits (23andMe sample) and psychiatric disorders.
(a) The heat map illustrates genetic correlations between phenotypes. The values in the color squares correspond to genetic correlations. Asterisks denote genetic correlations significantly different from zero: * P<0.05; ** P<0.00091 (Bonferroni correction threshold). (b) The loading plot shows loadings of the personality traits and psychiatric disorders on the first two principal components derived from the genetic correlation matrix on the left. A small angle between arrows indicates a high correlation between variables and arrows pointing to opposite directions indicate a negative correlation in the space of the two principal components.

