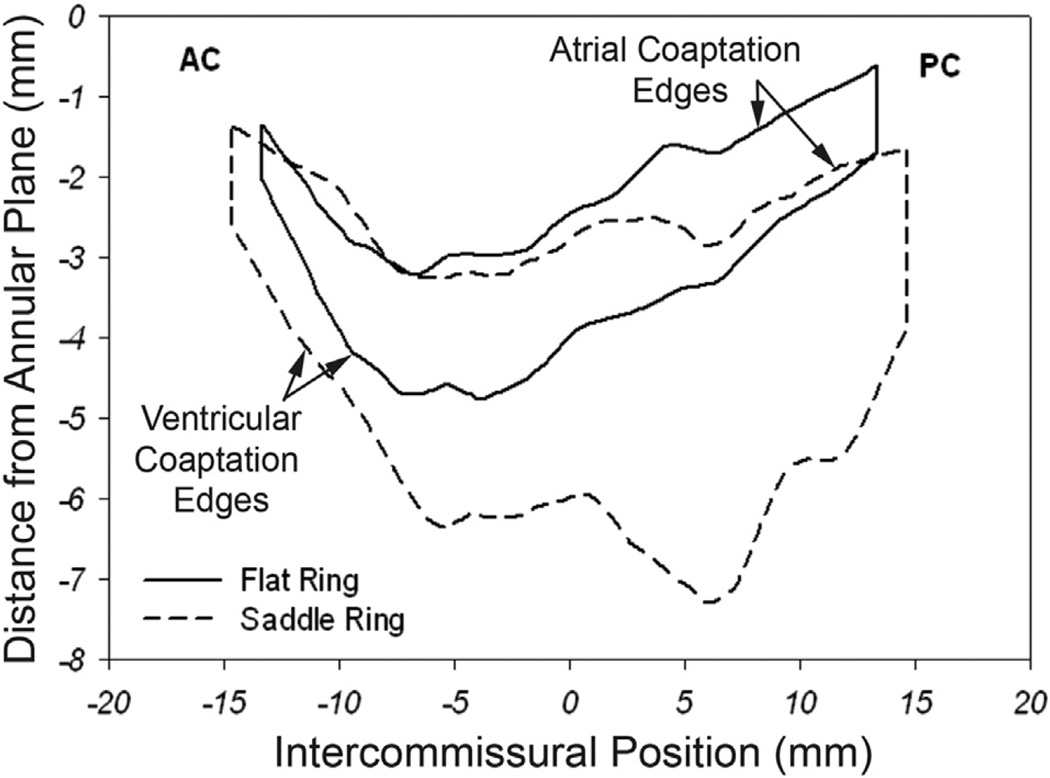
Fig 3.
Comparison of coaptation area and coaptation length. The black curve represents the two-dimensional projections of the averaged atrial and ventricular coaptation edges for the flat annuloplasty group. The area bounded by the two curves is the projected two-dimensional coaptation area. The distance between the two curves represents coaptation length at each intercommissural position. The dashed curve signifies similar parameters for the saddle-shaped annuloplasty group. The represented viewing plane is orthogonal to the averaged best-fit annular plane and passes through the line connecting the anterior commissure (AC) and the posterior commissure (PC). These composite images were created using interpolation of a normalized intercommissural sampling scale for each valve.

