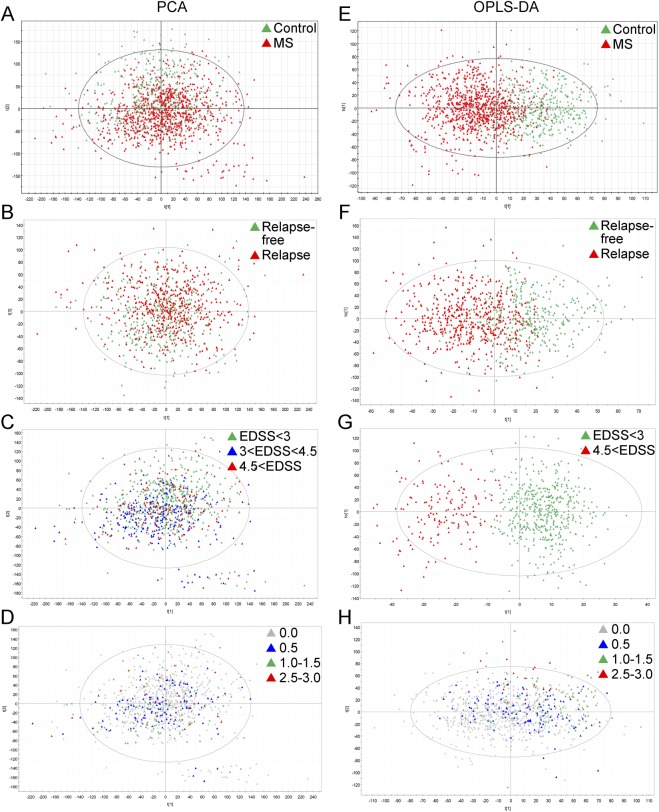
Figure 1. Metabolic signatures in the longitudinal cohort.
(A–D) Principal components analysis (PCA) models. Each model is a linear combination of the original retention time (Rt)–mass-to-charge (m/z) pair peak areas. Hotelling T2 statistic is shown on the plot, defining a 95% confidence ellipse for the samples included in the analysis. (A) Patients vs healthy controls (R2 = 0.247; Q2 = 0.128). (B) Patients with relapses during follow-up vs relapse-free patients (R2 = 0.380; Q2 = 0.128). (C) Patients reaching Expanded Disability Status Scale (EDSS) >4 from baseline to end of follow-up by month 24 (R2 = 0.380; Q2 = 0.126). (D) Patients with increase in the EDSS (ΔEDSS) from baseline to end of follow-up by month 24 (R2 = 0.381; Q2 = 0.129). R2 = Degree of fit (goodness of prediction); Q2 = predictive ability (goodness of prediction). (E–H) Orthogonal projection to latent structures (OPLS) models. (E) Patients vs healthy controls (R2X = 0.414; R2Y = 0.481; Q2Y = 0.348). (F) Patients with relapses during follow-up vs relapse-free patients (R2X = 0389; R2Y = 0.425; Q2Y = 0.231). (G) Patients reaching EDSS >4.0 from baseline to end of follow-up by month 24 (R2X = 0.512; R2Y = 0.756; Q2Y = 0.555). (H) Patients with ΔEDSS from baseline to end of follow-up by month 24 (R2X = 0.148; R2Y = 0.222; Q2Y = 0.036). R2X = degree of fit for X axis; R2Y = degree of fit for y-axis; Q2Y = predictive ability for y-axis. MS = multiple sclerosis.

