Fig.5.
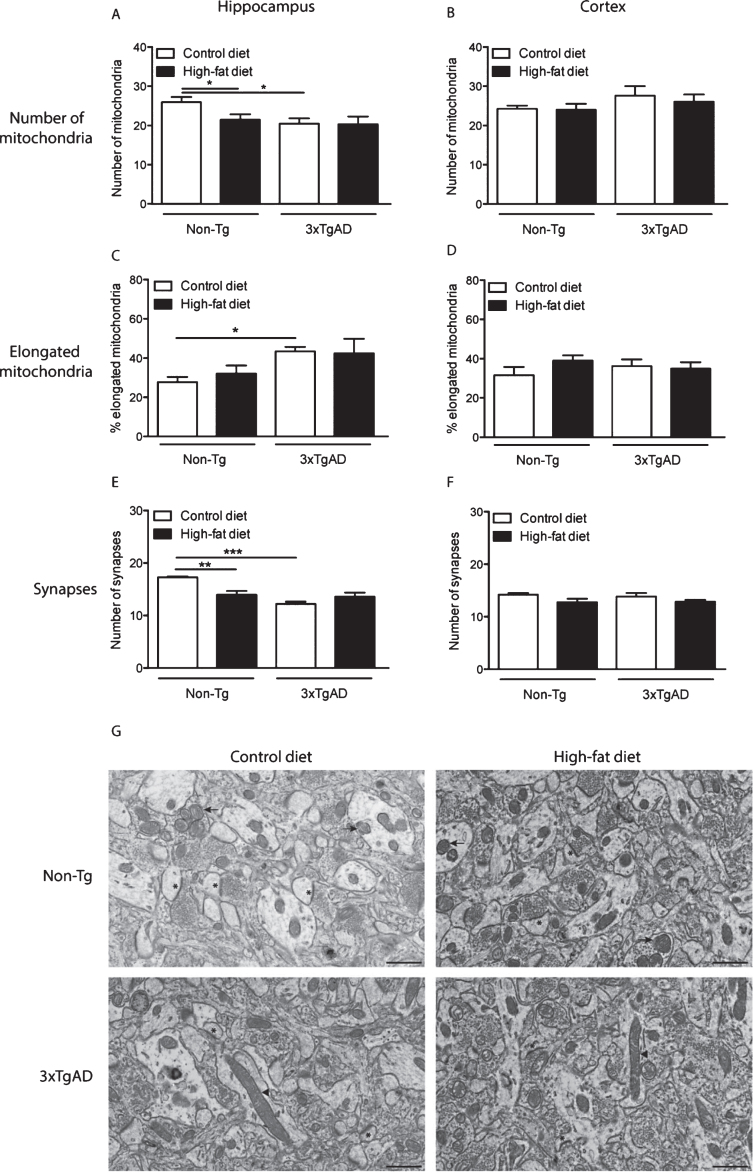
Changes in mitochondria and synapse number in the neuropil after a high-fat diet and in 3xTgAD mice. Groups of Non-Tg and 3xTgAD mice were maintained on a control or high-fat diet from 2 months to 8 months of age and the number and length of mitochondria and number of synapses were measured in the hippocampus (A, C, E) and cortex (B, D, F) in 10 different fields of view (63 μm2)/animal. The average number of mitochondria and synapses, and the percentage of elongated mitochondria (defined as length > 0.5 μm) were calculated (A-F). Data are mean±SEM, n = 6-7/group (male and female). *p < 0.05, **p < 0.01, ***p < 0.001; Two-way ANOVA with Bonferroni post hoc analysis. G) Electron micrographs illustrating the presence of mitochondria and synapses in the hippocampal neuropil of Non-Tg and 3xTgAD mice fed a control or high-fat diet. Control and high-fat fed 3xTgAD mice presented with longer mitochondria (arrowheads) compared to the normal mitochondria (arrows) with round shape and form observed in control-fed Non-Tg mice. Synapses are also illustrated (asterisks). Scale bar: 1 μm.

