Table 3.
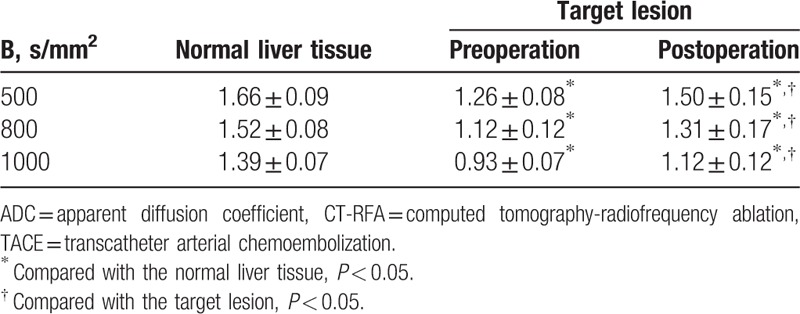
Comparison of ADC values of target lesions and normal liver tissue before and after TACE combined with CT-RFA (×10–3 mm2/s).

Comparison of ADC values of target lesions and normal liver tissue before and after TACE combined with CT-RFA (×10–3 mm2/s).
