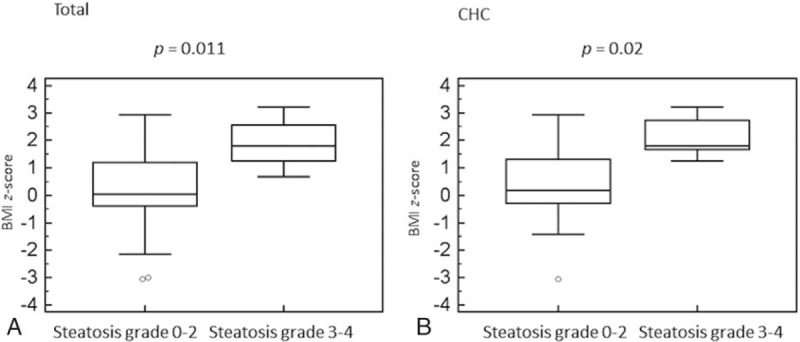
Figure 3.

Box-and-whiskers plot for body mass index z-score in children with moderate-to-severe steatosis. The top and bottom of each box are the 25th and 75th percentiles. The line through the box is the median and the error bars are the maximum and minimum. CHC = chronic hepatitis C.
