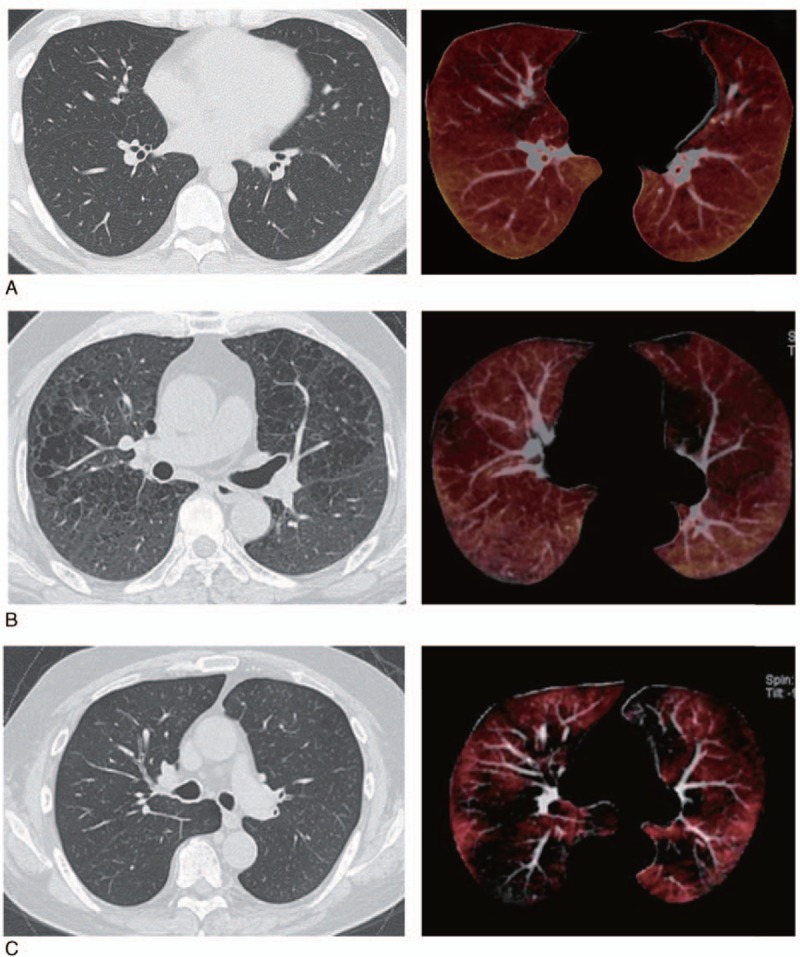
Figure 1.

Comparison of conventional or thin-slice CT (left) and xenon images (right). (A) A 33-year-old healthy male, nonsmoker. Conventional CT and pulmonary function test results were within normal limits. (B) A 69-year-old male with COPD. The FEV1/FVC ratio was 62%. Pulmonary emphysema is depicted as low-attenuation areas on thin-slice CT (left) corresponding to areas of low attenuation on xenon CT (right). (C) A 66-year-old male with COPD. The FEV1/FVC was 33%. Xenon images (right) show low-attenuation areas which are not seen on thin-slice CT (left). COPD = chronic obstructive pulmonary disease, CT = computed tomography, FEV1/FVC = ratio of forced expiratory volume in 1 second to forced vital capacity.
