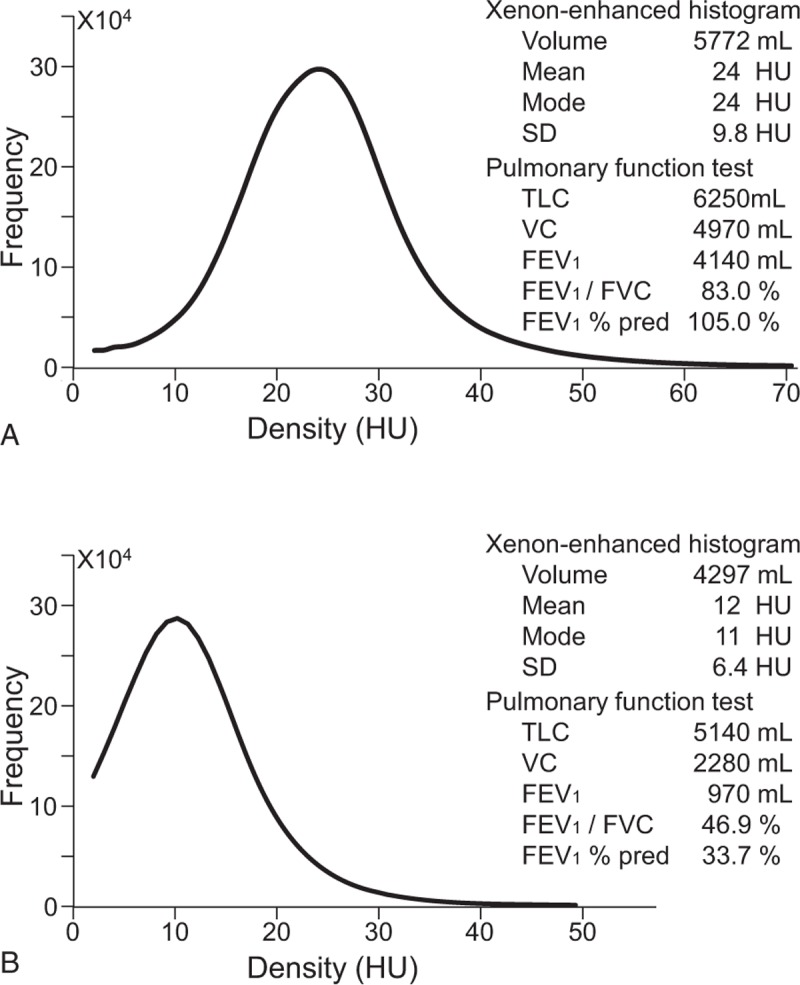
Figure 2.

Xenon histogram. (A) Density histogram of the xenon images of a 33-year-old healthy male with normal pulmonary function. (B) Density histogram of the xenon images of a 66-year-old patient with COPD stage III. The mode of the histogram was shifted to the left compared to that of a patient with better FEV1/FVC and FEV1% pred. COPD = chronic obstructive pulmonary disease, FEV1/FVC = ratio of forced expiratory volume in 1 second to forced vital capacity, FEV1% pred = FEV1 as a percentage of predicted.
