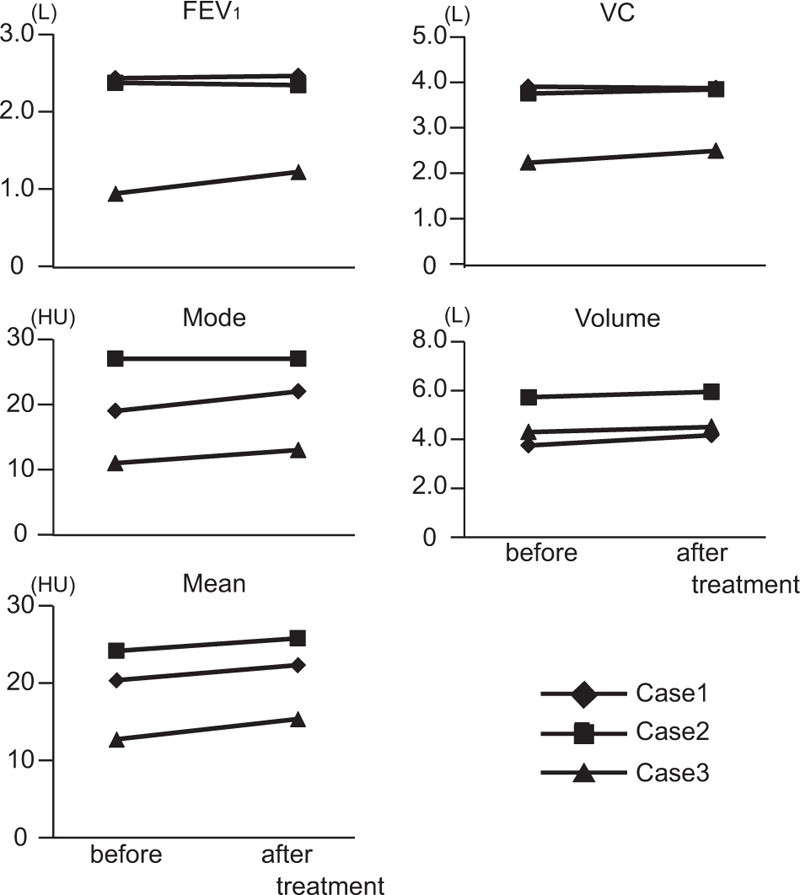
Figure 4.

Changes in basic statistics of xenon-enhanced CT and pulmonary function tests by treatment for COPD. Xenon CT and pulmonary function tests were performed before and after treatment with bronchodilators in three COPD patients. Cases 1 (diamond) and 3 (triangle) show increase in FEV1, and the mode and volume of the histogram were shifted to the right after treatment. COPD = chronic obstructive pulmonary disease, CT = computed tomography, FEV1 = forced expiratory volume in 1 second, xenon-enhanced CT = xenon-enhanced dual-energy computed tomography.
