
Fig. 1. Activity of cEt (Gen 2.5) STAT3 ASO (AZD9150) and Gen 2.0 STAT3 ASO in tumor cells in vitro.
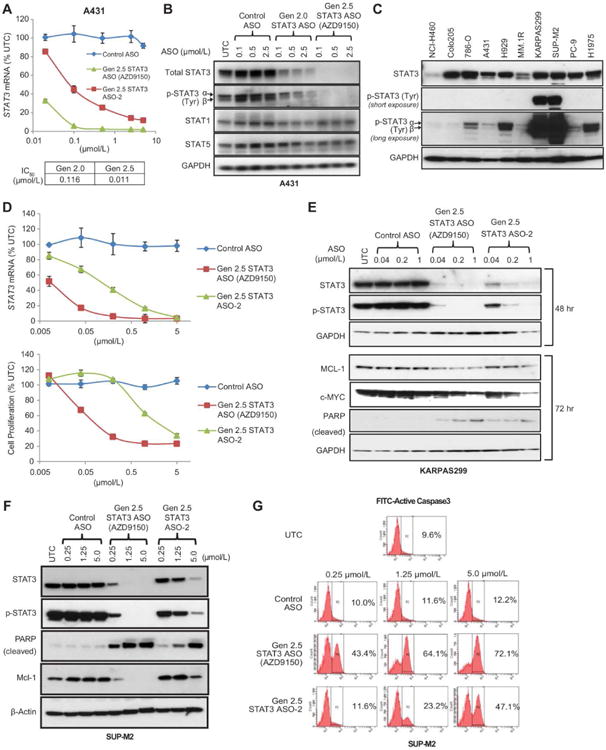
(A) Gen 2.0 MOE or cEt STAT3 ASO along with control ASO were delivered to human epidermoid cancer A431 cells via free uptake. STAT3 knockdown was determined by qRT-PCR. IC50 values for Gen 2.0 and Gen 2.5 cEt STAT3 ASOs calculated using GraphPad Prism software are shown. (B) Total cell lysates were collected for immunoblot analysis 3 days after ASO treatment. Amounts of total and phosphorylated forms of STAT3 protein as well as other STAT members, STAT1 and STAT5, were compared. (C) Amounts of total and phosphorylated STAT3 were measured in a variety of human tumor cell lines by immunoblot analysis. (D-G) Two cEt STAT3 ASOs along with a control ASO with the same chemistry were delivered to human anaplastic large T-cell lymphoma (ALCL) lines, SUP-M2 and KARPAS299, by free uptake. STAT3 mRNA concentration and cell proliferation were determined in KARPAS299 at 24 h and on day 5, respectively (D). The amounts of c-MYC and MCL-1 proteins, which are regulated by STAT3, also decreased at 72 h, after the decrease in STAT3 protein (E). Downregulation of STAT3 by the cEt STAT3 ASOs also resulted in strong apoptosis in SUP-M2 cells, as demonstrated by immunoblot analysis for cleaved PARP, a surrogate marker for apoptosis at 72 h (F), and FACS analysis for active caspase-3 at 72 h (G). UTC: untreated cells. These experiments have been replicated at least 3 times. Graphs in A and D show the means ± standard deviations (SD) of n = 3.