
Fig. 5. Antitumor activity of AZD9150 in tumor models.
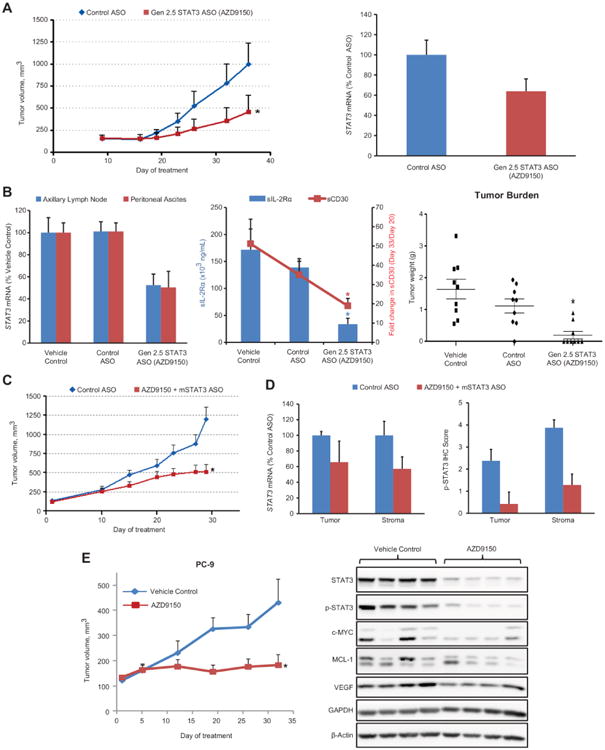
(A) Animals bearing SUP-M2 cells in the left flank region were treated with cEt (Gen 2.5) STAT3 ASO or control ASO at 50 mg/kg, 5 times per week for 5 weeks. cEt STAT3 ASO (AZD9150) significantly inhibited tumor growth compared to the control ASO (TGI = 62%) (*P = 0.0018) (n=16 mice per group) (left panel) even with modest STAT3 downregulation in the tumor (right panel). (B) SUP-M2 cells were intravenously injected into NSG mice. Twenty days later, animals were randomized on the basis of soluble CD30 (sCD30) concentration and treated with either control ASO or cEt STAT3 ASO at 50 mg/kg, 5 times per week for 2 weeks. Reductions in STAT3 mRNA in axillary lymph nodes and peritoneal ascites of the STAT3 ASO-treated group (left panel), in plasma sIL-2Rα (*P = 0.0023) and sCD30 (*P = 0.0043) concentrations (middle panel), and in tumor burden (*P = 0.001) (n = 9 mice per group) (right panel) were assessed. (C-D) Mice transplanted with human patient-derived primary DLBCL tumors in the flank region were treated with either control ASO or AZD9150 plus mouse STAT3-targeting ASO at 50 mg/kg, 5 times per week for 4 weeks. Tumor growth was significantly inhibited in the STAT3 ASO-treated group compared to the control ASO group (TGI = 67%) (*P = 0.001) (n = 7-8 mice per group) (C). STAT3 mRNA knockdown in tumor and stroma cells was demonstrated in STAT3 ASO-treated group by qRT-PCR using species-specific probe/primer sets (D, left panel). A decrease in phospho-STAT3 protein in both tumor and stromal cells with STAT3 ASO treatment was also quantified from IHC (D, right panel). (E) Animals bearing human NSCLC PC-9 cells in the flank region were treated with AZD9150 alone at 25 mg/kg, 5 times per week for about 5 weeks. Tumor growth was significantly delayed with AZD9150 treatment compared to control (left panel) (TGI = 90%) (*P = 0.027) (n = 7 mice per group), which also correlated with marked reductions in both total STAT3 and phospho-STAT3 protein as well as STAT3 targets (right panel). Graphs in A to E show the means ± SEM.