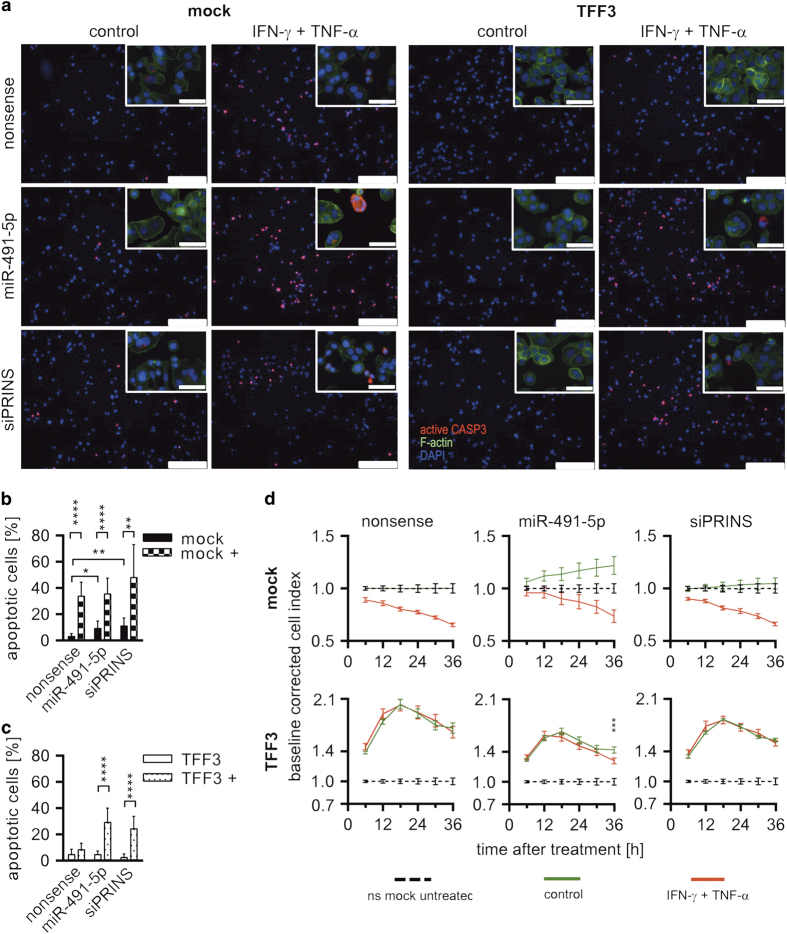
Figure 2.
miR-491-5p-mediated PRINS regulation controls apoptosis of colorectal adenocarcinoma cells. (a) Apoptosis of miR-491-5p or siPRINS-transfected along with TNF-α/IFN-γ treatment was evaluated by IF detection of active caspase-3. Scale bars indicate 25 nm. Upper right section shows micrographs at higher magnification. Scale bars indicate 50 nm. (b and c) The number of apoptotic cells (positive for active caspase-3) was quantified using ImageJ considering at least four sections of three biological replicates of each treatment. Black columns show untreated mock controls and columns with squares mocks treated with TNF-α/IFN-γ. White columns show untreated HT-29/B6/TFF3 cells and dotted columns HT-29/B6/TFF3 cells treated with TNF-α/IFN-γ (+). Error bars indicate the S.D. (d) Cell indices of HT-29/B6/TFF3- and mock-transfected cells were determined after miR-491-5p or siPRINS transfection along with TNF-α/IFN-γ treatment by means of xCELLigence analysis over 36 h. Nonsense-transfected mock controls were selected as baseline and data were baseline corrected (cell indexsample/cell indexmock nonsense untreated). Bars show S.D. of at least four replicates. Values were log2 transformed. Columns show means of at least three biological replicates and bars indicate S.D. *P<0.05; **P<0.01; ***P<0.001; ****P<0.0001, unpaired t-test.

