Figure 3.

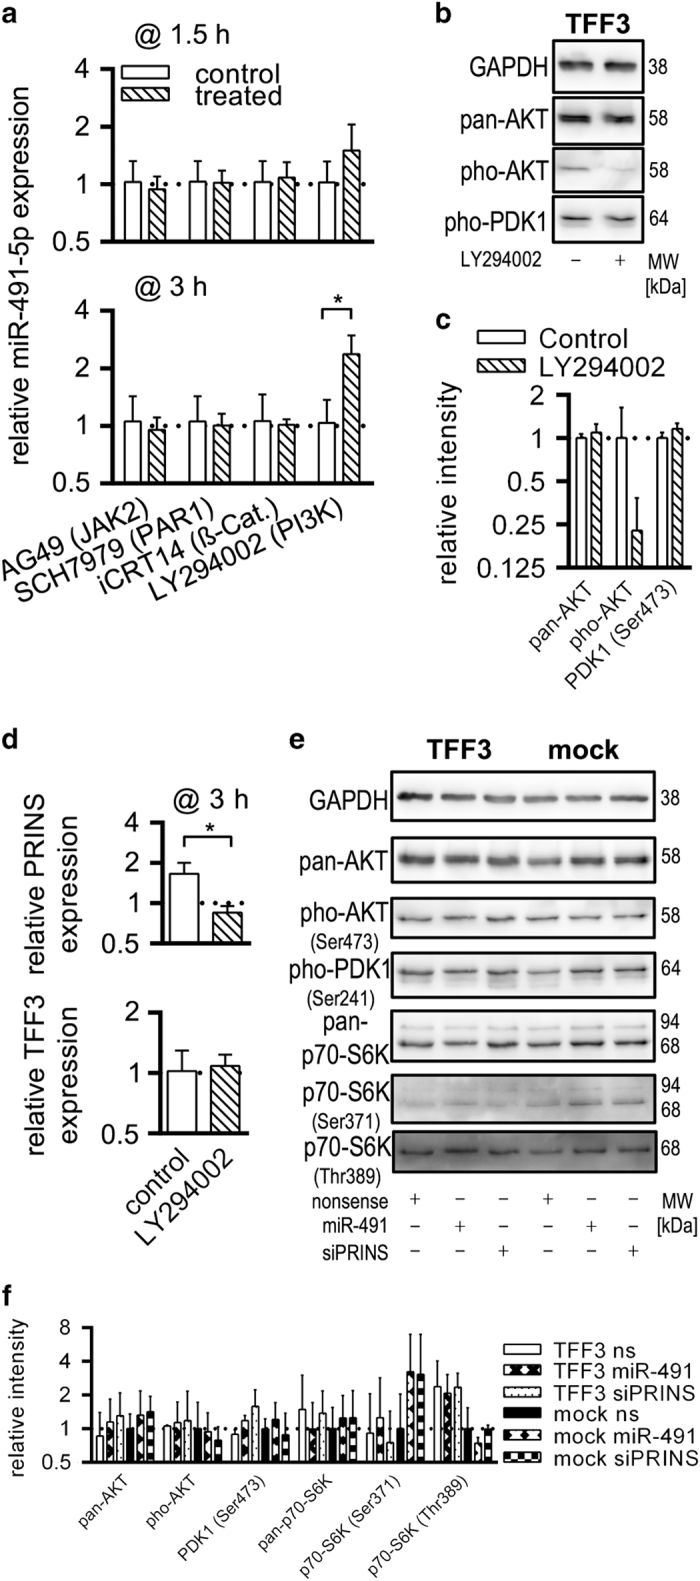
Decreased levels of miR-491-5p in TFF3-overexpressing HT-29/B6 cells depend on PI3K-AKT activation. (a) SMIs for relevant pathways (JAK2, PAR1, β-catenin and PI3K) were used to test for compensation of miR-491-5p dysregulation in HT-29/B6/TFF3 cells. White columns represent controls and hatched columns treated cells. Bars indicate the S.D. Values were log2 transformed. (b) Western blotting proved the functionality of the PI3K inhibitor in HT-29/B6/TFF3 cells. Black borders indicate cropped area of the western blot. Molecular weights (MWs) were determined with the Fusion Capt Advance Software (Vilber Lourmat) according to the MW marker Page Ruler Plus Prestained Protein Ladder (Thermo Fisher Scientific GmbH). (c) Densitometric analysis of b signals was performed using the Fusion Capt Advance Software (Vilber Lourmat, Eberhardzell, Germany). Columns show normalised means (protein of interest/GAPDH) of three independent replicates and bars represent the S.D. Values were log2 transformed. (d) PI3K inhibition decreased cellular levels of PRINS and had no effect on TFF3 levels. Values were log2 transformed. (e) Western blot detection of phosphorylation status of AKT, PDK1 and p70-S6K upon miR-491-5p or siPRINS transfection were determined. Black borders indicate cropped area of the western blot. MWs were determined with the Fusion Capt Advance Software (Vilber Lourmat) according to the MW marker Page Ruler Plus Prestained Protein Ladder (Thermo Fisher Scientific GmbH). (f) Densitometric analysis of section e was performed using the Fusion Capt Advance Software (Vilber Lourmat). Columns show normalised means (protein of interest/GAPDH) of three independent replicates and bars represent the S.D. Values were log2 transformed.
