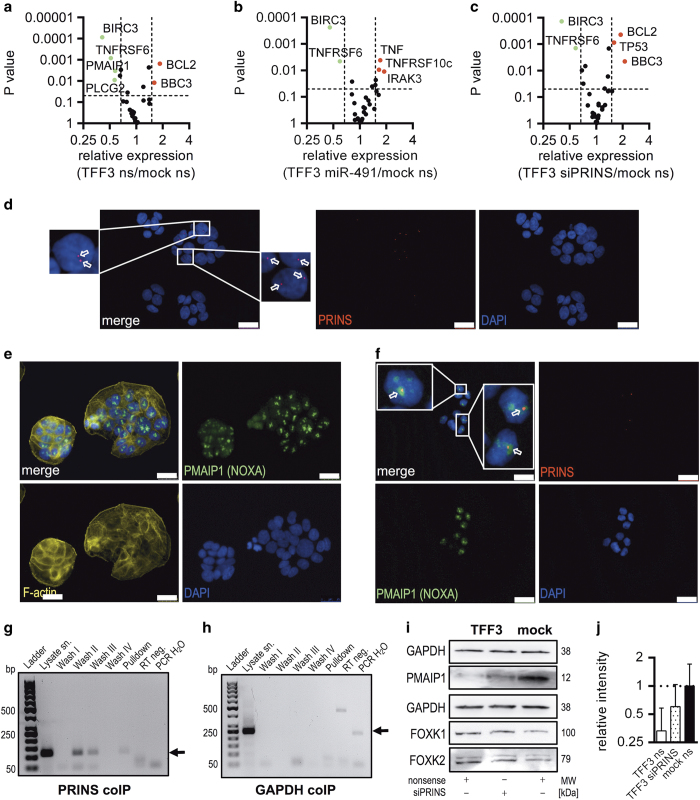
Figure 4.
PRINS interacts with PMAIP1 and determines its availability. (a–c) Volcano plots show significantly dysregulated apoptosis-relevant genes in nonsense, miR-491-5p or siPRINS-transfected HT-29/B6/TFF3 cells compared with nonsense-transfected mock controls (green: significantly downregulated; red: significantly upregulated). (d) PRINS localisation was determined by Stellaris FISH, arrows show focal PRINS signals (red: PRINS, blue: DAPI, scale bars indicate 25 nm). (e) PMAIP1 localisation was determined by IF (green: PMAIP1, yellow: f-actin, blue: DAPI, scale bars indicate 25 nm). (f) Colocalisation of PRINS with PMAIP1 was determined by combination of FISH and IF (red: PRINS, green: PMAIP1, blue: DAPI, scale bars indicate 25 nm). (g and h) Co-IP using the PMAIP1-specific antibody (CST, #D8L7U), experiments show specific interaction of PRINS with PMAIP1 proved by PCR (pulldown sample). Lysate supernatant (sn) and diverse washes were taken as controls. GAPDH serves as control for assay specificity. (i) PRINS knockdown in HT-29/B6/TFF3 cells causes accumulation of PMAIP1 with no differences in FOXK1 and 2. Black borders indicate cropped area of the western blot. MWs were determined with the Fusion Capt Advance Software (Vilber Lourmat) according to the MW marker Page Ruler Plus Prestained Protein Ladder (Thermo Fisher Scientific GmbH). (j) Densitometric analysis of section i was performed using the Fusion Capt Advance Software (Vilber Lourmat). Columns show normalised means (protein of interest/GAPDH) of three independent replicates and bars represent the S.D. Values were log2 transformed.

