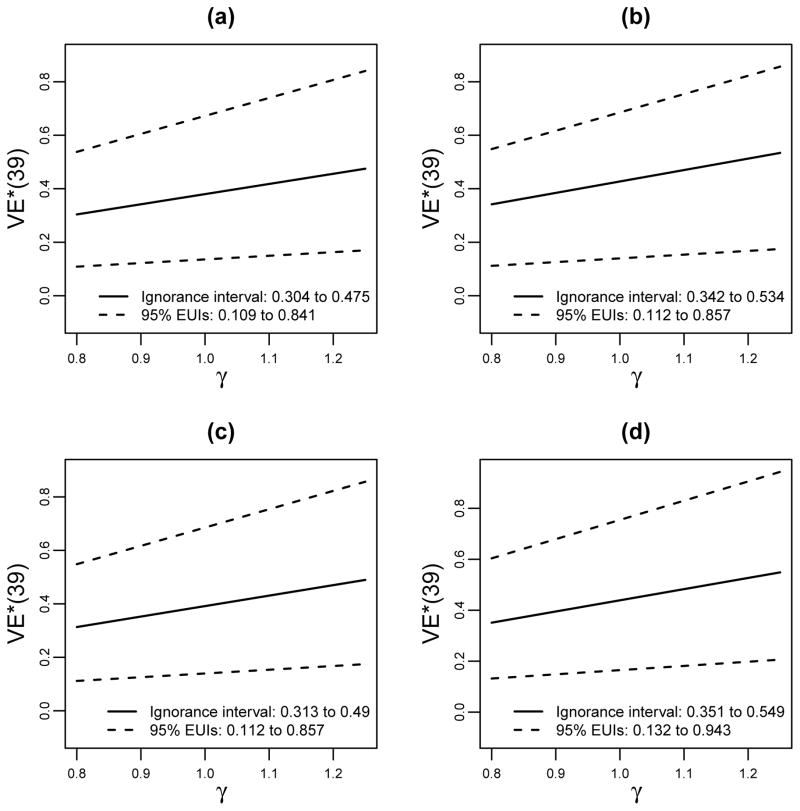
Figure 4.
The analysis of Figure 3 repeated assuming average causal necessity for the X = 1 subgroup instead of the X = 0 subgroup, VE(t = 39, v = 0|s1 = 0, x = 1) = 0, under which the estimated curves are steeper in s1 (stronger effect modification).

