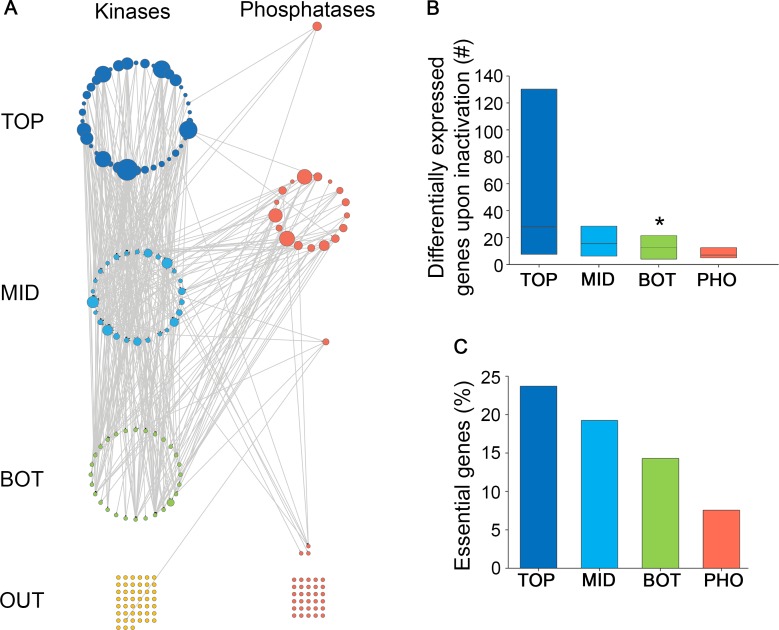
Fig 3. A hierarchical organization of yeast kinases by their impact.
A. A layered architecture of kinases by their impact on the phosphorylation of each other. Impact edges point from the inactivated kinase (or phosphatase) down to its differentially-phosphorylated targets. Kinases and phosphatases with no impact relationship to other kinases / phosphatases appear as grids at the bottom. Kinases in the top, middle and bottom layers appear as blue, light-blue or green nodes, respectively; phosphatases appear in red. Node sizes reflect the number of target proteins. B. The impact of kinases and phosphatases on gene expression. Impact of an individual kinase (or phosphatase) was defined as the number of genes that were differentially expressed upon kinase (or phosphatase) inactivation. The impact of kinases from each layer decreased upon moving down the hierarchy, with bottom-layer kinases affecting the expression of significantly smaller sets of genes (p = 0.037, Mann-Whitney test). Data were available for 14 top-layer, 10 middle-layer, and 10 bottom-layer kinases, and for 18 phosphatases. Box plots show the values at the first, second and third quartiles. C. The phenotypic impact of kinases and phosphatases, as measured by the percentage of essential genes in each subset. The phenotypic impact of kinases decreased upon moving down the hierarchy. TOP = top layer, MID = middle layer, BOT = bottom layer, OUT = outgroup, PHO = phosphatases. * indicates p<0.05.

